Candidate experience metrics: 6 must-track KPIs to hire better
Candidate experience metrics — the quantitative signals that reveal how applicants perceive and move through your hiring process — are now a leading indicator of offer acceptance, employer brand strength, and cost per hire. Recruiters who treat these metrics as a dashboard, not a debrief, fix drop-off before it damages the funnel. This guide breaks down six candidate experience metrics worth tracking, the benchmarks that separate healthy pipelines from broken ones, and a contrarian view on where these numbers mislead.
Use the data you gather to see how candidates interact with job postings, how they click through the application form, and what their profile looks like at different stages of the application process. Good employer branding means little if the candidate experience metrics behind your funnel are hiding drop-off, ghosting, or bias.
Candidate experience metrics: which are the most relevant?

1. Time-to-hire
Time-to-hire is the number of days between a candidate entering your pipeline (applying or being sourced) and accepting an offer. It is one of the most watched candidate experience metrics because delays cost offers, revenue, and morale.
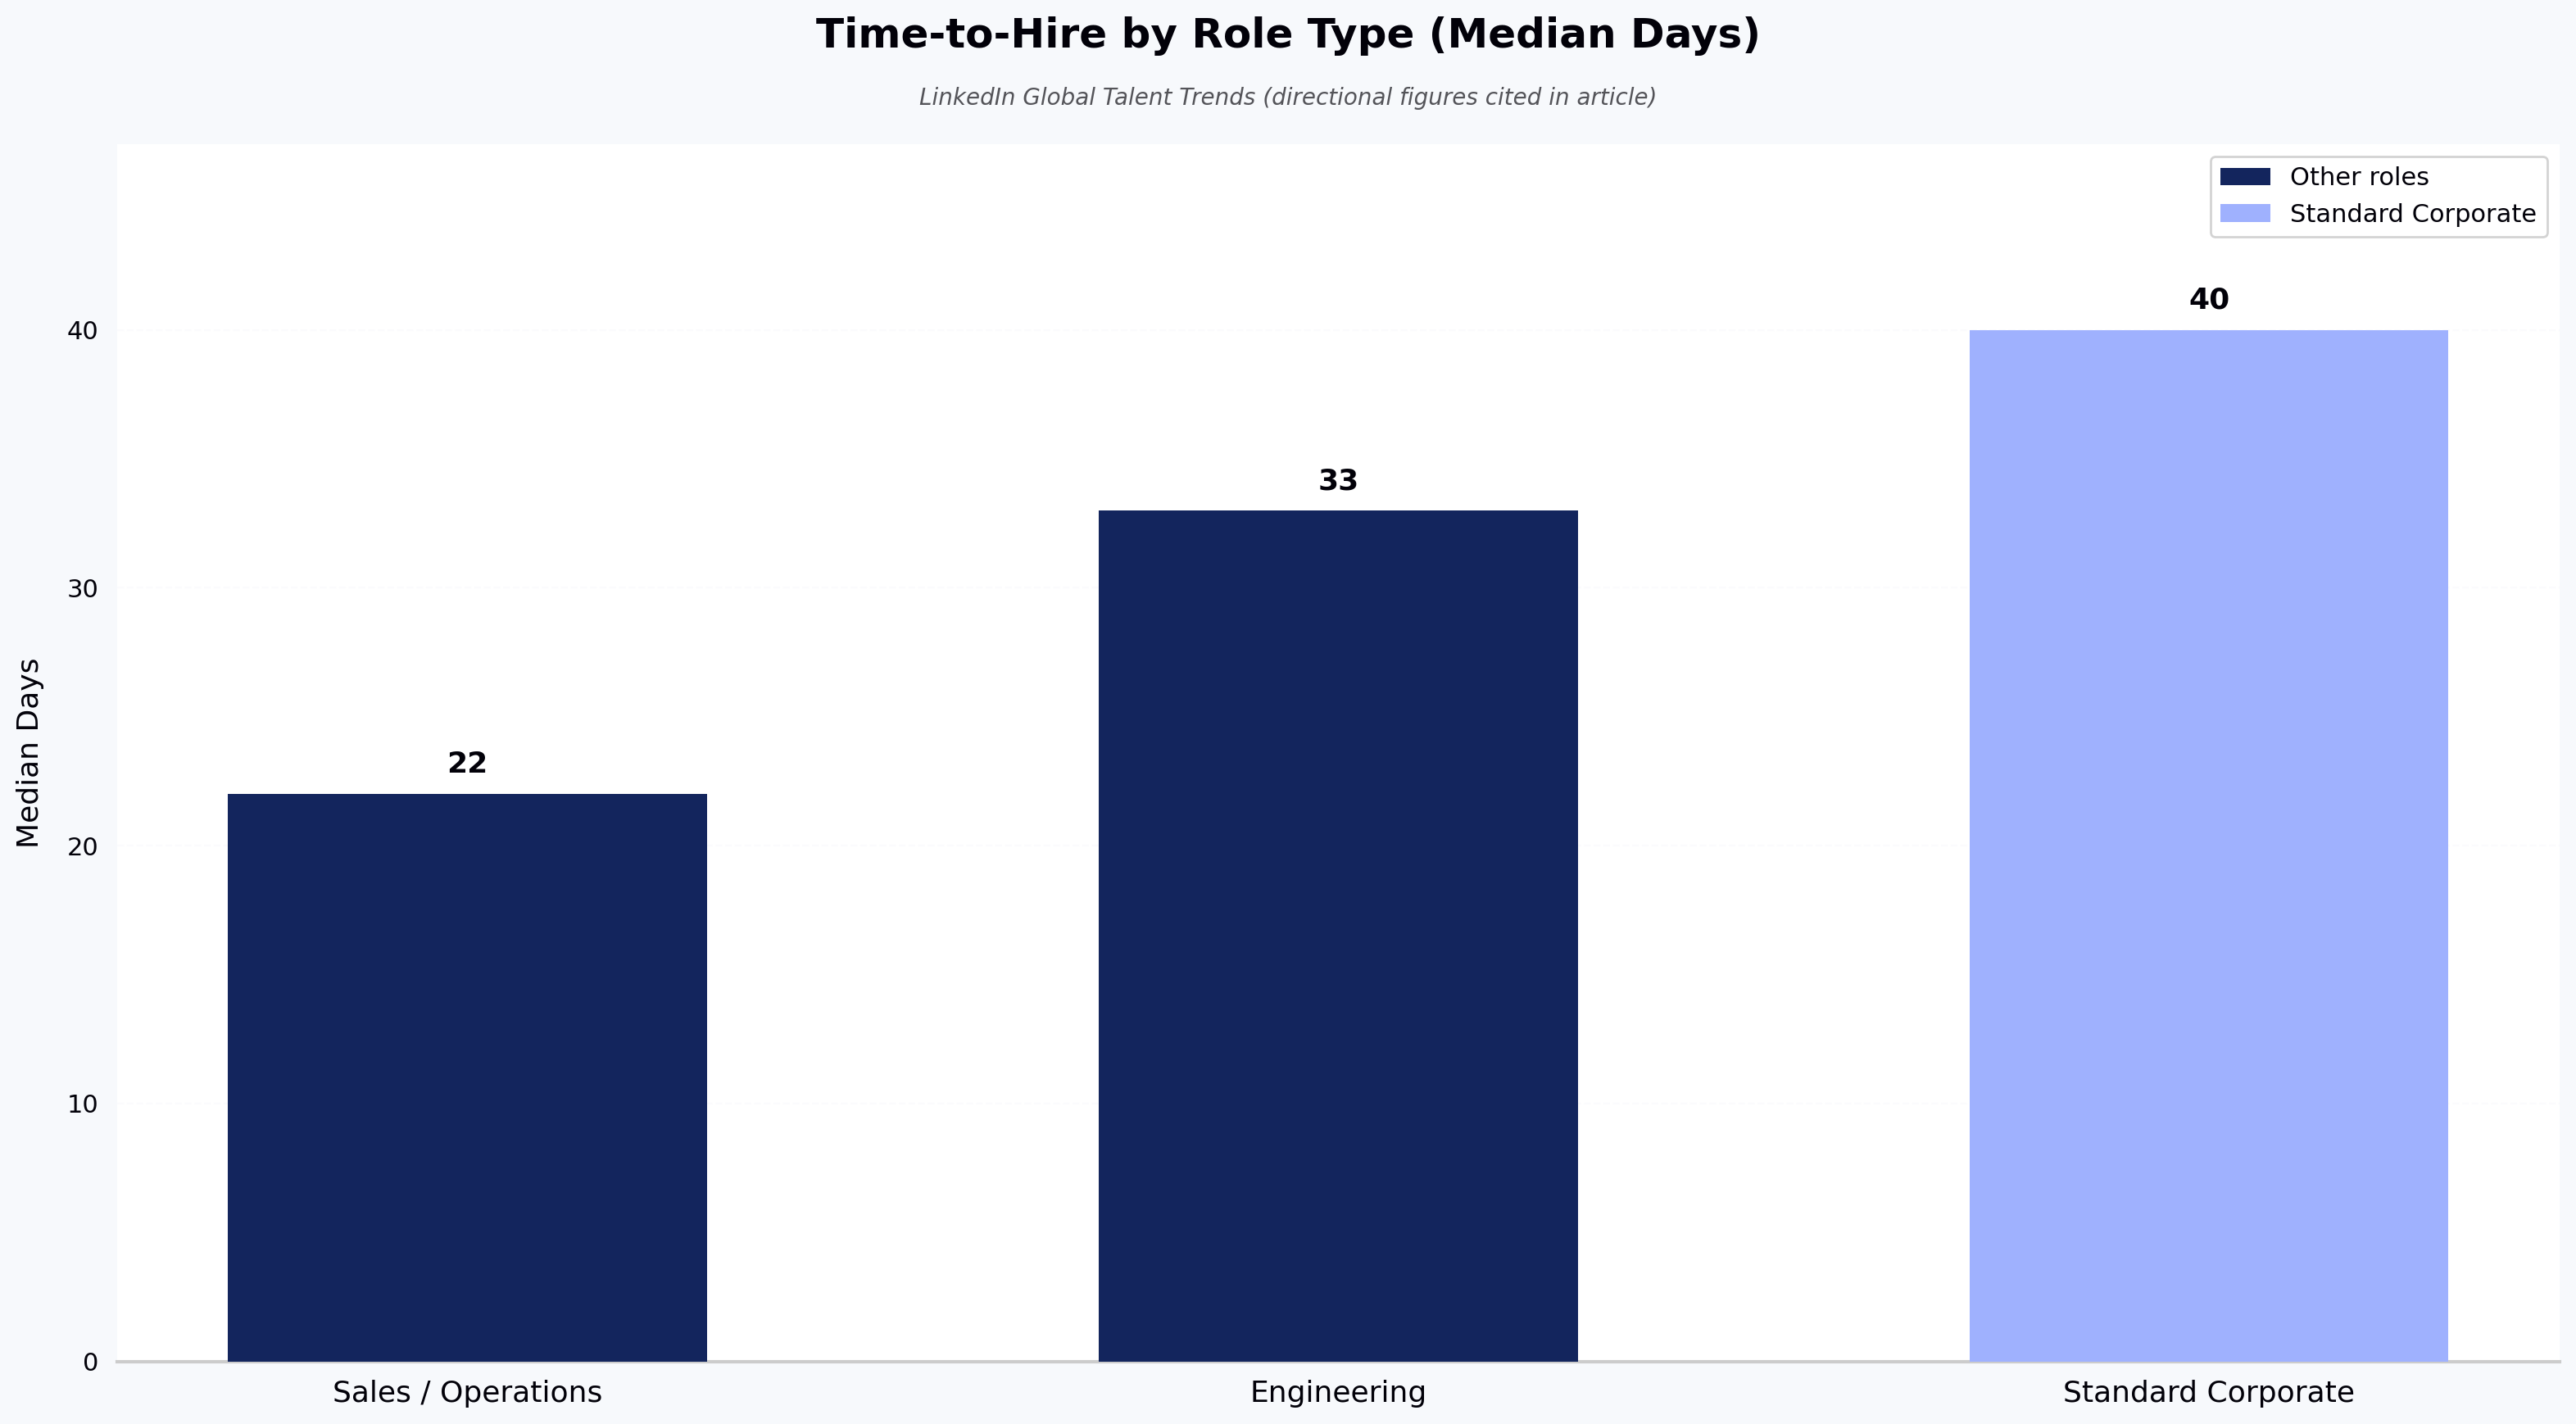
LinkedIn's Global Talent Trends reporting has historically placed median time-to-hire in the range of roughly 33 days for engineering roles and 20–25 days for operations or sales, with figures beyond 40 days for standard corporate roles tending to correlate with higher drop-off. Exact figures shift year-to-year, so treat these as directional rather than absolute.
Contrarian note: shrinking time-to-hire aggressively can harm quality-of-hire. Recruiters who compress cycles by cutting assessment rigor often see stronger short-term speed metrics and weaker 6-month retention. Track time-to-hire alongside quality-of-hire, not in isolation.
Most applicant tracking systems expose this metric natively. Where the technical-screen stage inflates cycle time, HackerEarth Assessments reduces time-to-hire by replacing resume screening with structured skill evaluation — so panels only see candidates whose skills have already been scored against the role.
Also read: Data-driven recruiting – all you need to know
2. Interview-to-offer ratio
Interview-to-offer ratio is the number of interviews conducted divided by the number of offers extended. It tells you whether your screening stage is accurate or wasteful.
As a practitioner rule-of-thumb, a healthy ratio for most knowledge-work roles sits around 3:1 to 4:1. Ratios above 6:1 usually signal a screening problem — either loose top-of-funnel criteria or interviewers optimizing for the wrong signal.
If your ratio is high, the fix is rarely "add more interviewers." It is usually to strengthen the screen before the interview loop begins. Structured, skill-based assessments cut the number of unqualified candidates that reach panel interviews by making capability, not resume signals, the gating criterion.
3. Interview no-show and completion rate
Interview no-show rate is the percentage of scheduled interviews that candidates do not attend. Completion rate is the inverse — the share of candidates who finish every scheduled stage. Both are directly measurable, which is why they belong in a metrics article; interviewer training is a lever, not a metric.
As a common practitioner benchmark, a no-show rate above 10% typically indicates scheduling friction, weak recruiter communication, or a competing offer. Track it by stage to find where candidates disengage.
To keep the panel itself consistent across candidates, structured interviews with pre-defined scoring rubrics help — automated interview tools can make evaluations more consistent across candidates, though they do not eliminate bias on their own.
Also read: 5 steps to create a remote-first candidate experience in recruitment
4. Candidate net promoter score (cNPS)
Candidate NPS is the score candidates give when asked, on a 0–10 scale, how likely they are to recommend your hiring process to a peer. It is calculated as % promoters (9–10) minus % detractors (0–6).
Recent editions of Talent Board's Candidate Experience Research Report have placed a strong cNPS above +50, with global averages hovering in the +20 to +30 range. Because Talent Board publishes annually and figures shift year-to-year, treat these as directional benchmarks rather than fixed targets. A negative cNPS is a red flag.
Contrarian note: cNPS in isolation is misleading. Rejected candidates disproportionately drive scores down, and offered candidates disproportionately drive them up — so cNPS often measures outcome, not experience. Segment scores by stage and by outcome (rejected vs. hired vs. withdrew) to see the real signal.
If your score is low, look at where candidates report the friction: unclear job descriptions, long silences between stages, or unstructured interviews are the usual culprits.
5. Offer acceptance rate: the clearest downstream candidate experience metric
Offer acceptance rate is the percentage of extended offers that candidates accept. It is the clearest downstream measure of whether the rest of your candidate experience metrics are working.
Commonly cited industry guidance places a healthy offer acceptance rate at 85–90% for most corporate roles. Below 70%, you likely have a compensation gap, a slow process, or a late-stage experience problem.
If acceptance is soft, audit the gap between final interview and offer. Long silences, generic offer letters, and vague compensation conversations account for most declines.
Some organizations experiment with re-engaging strong rejected candidates for later roles or referrals; this is worth trying selectively for finalists who lost on a close call, but is not realistic as a broad practice.
Also read: Building an employee experience roadmap
6. Candidate drop-off rate
Candidate drop-off rate is the percentage of applicants who start but do not complete an application, or who exit between defined stages. A bad candidate experience directly inflates this number.
How to calculate it: (candidates who exited a stage ÷ candidates who entered that stage) × 100. Calculate per stage, not just overall.
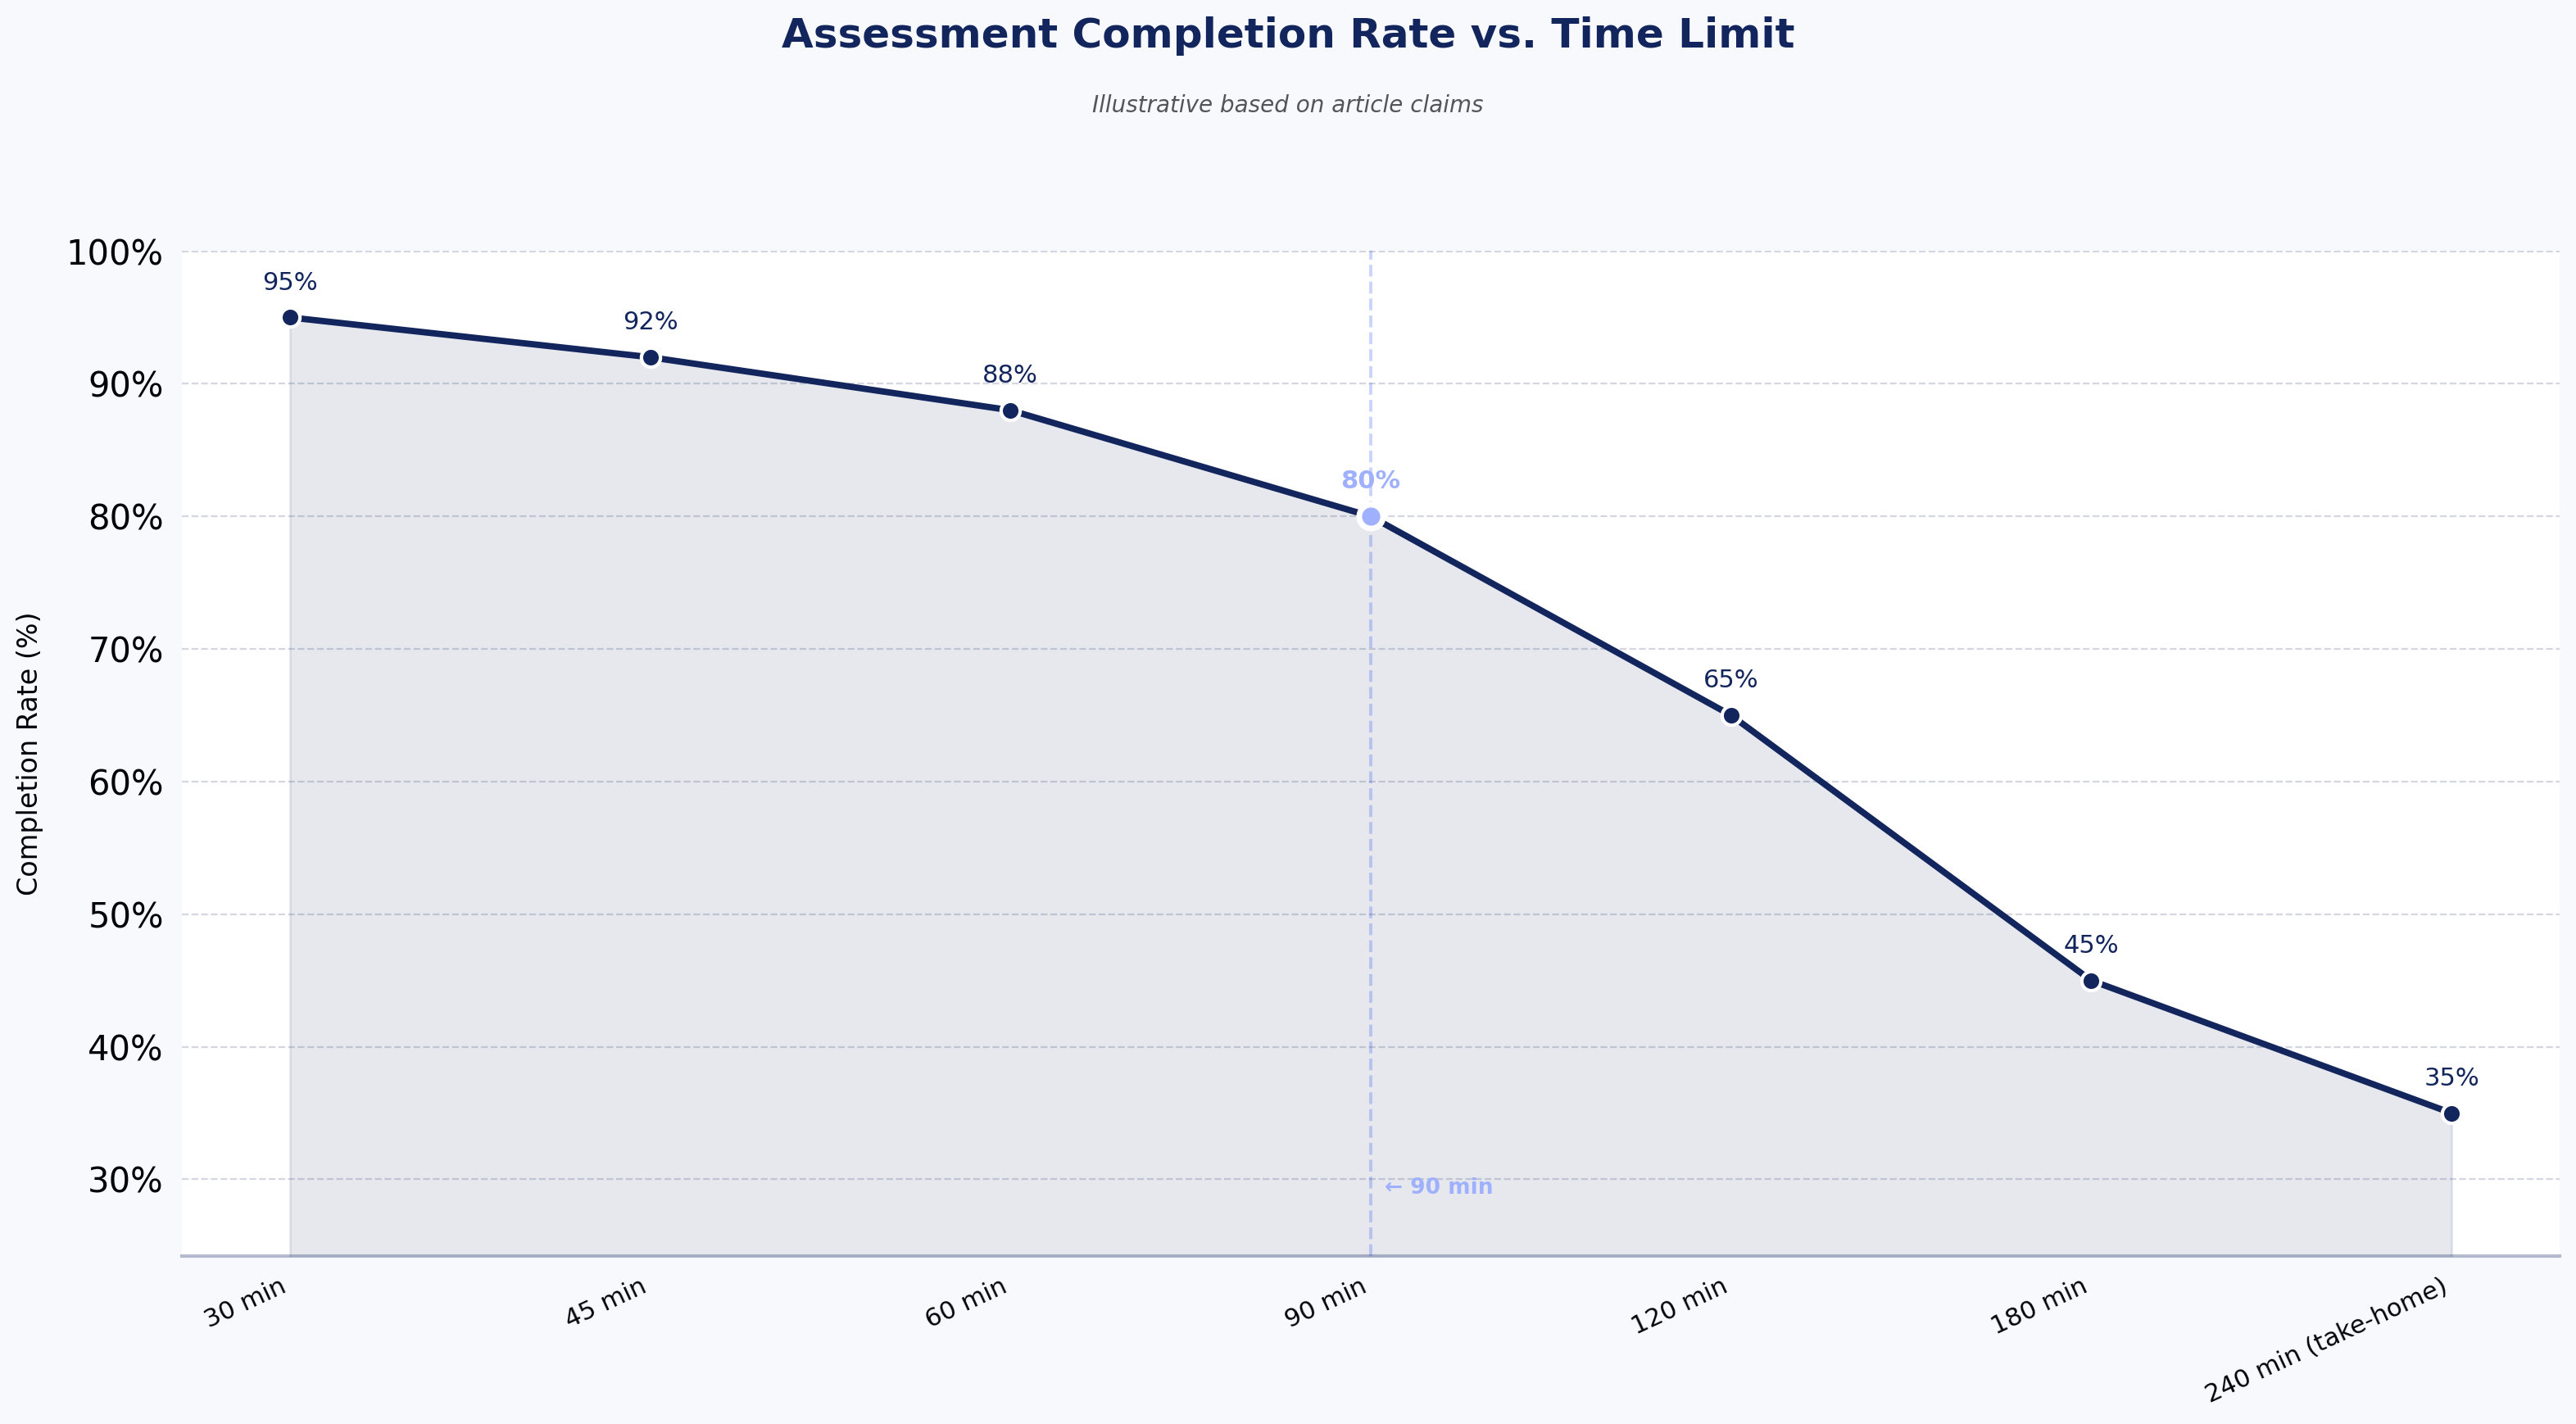
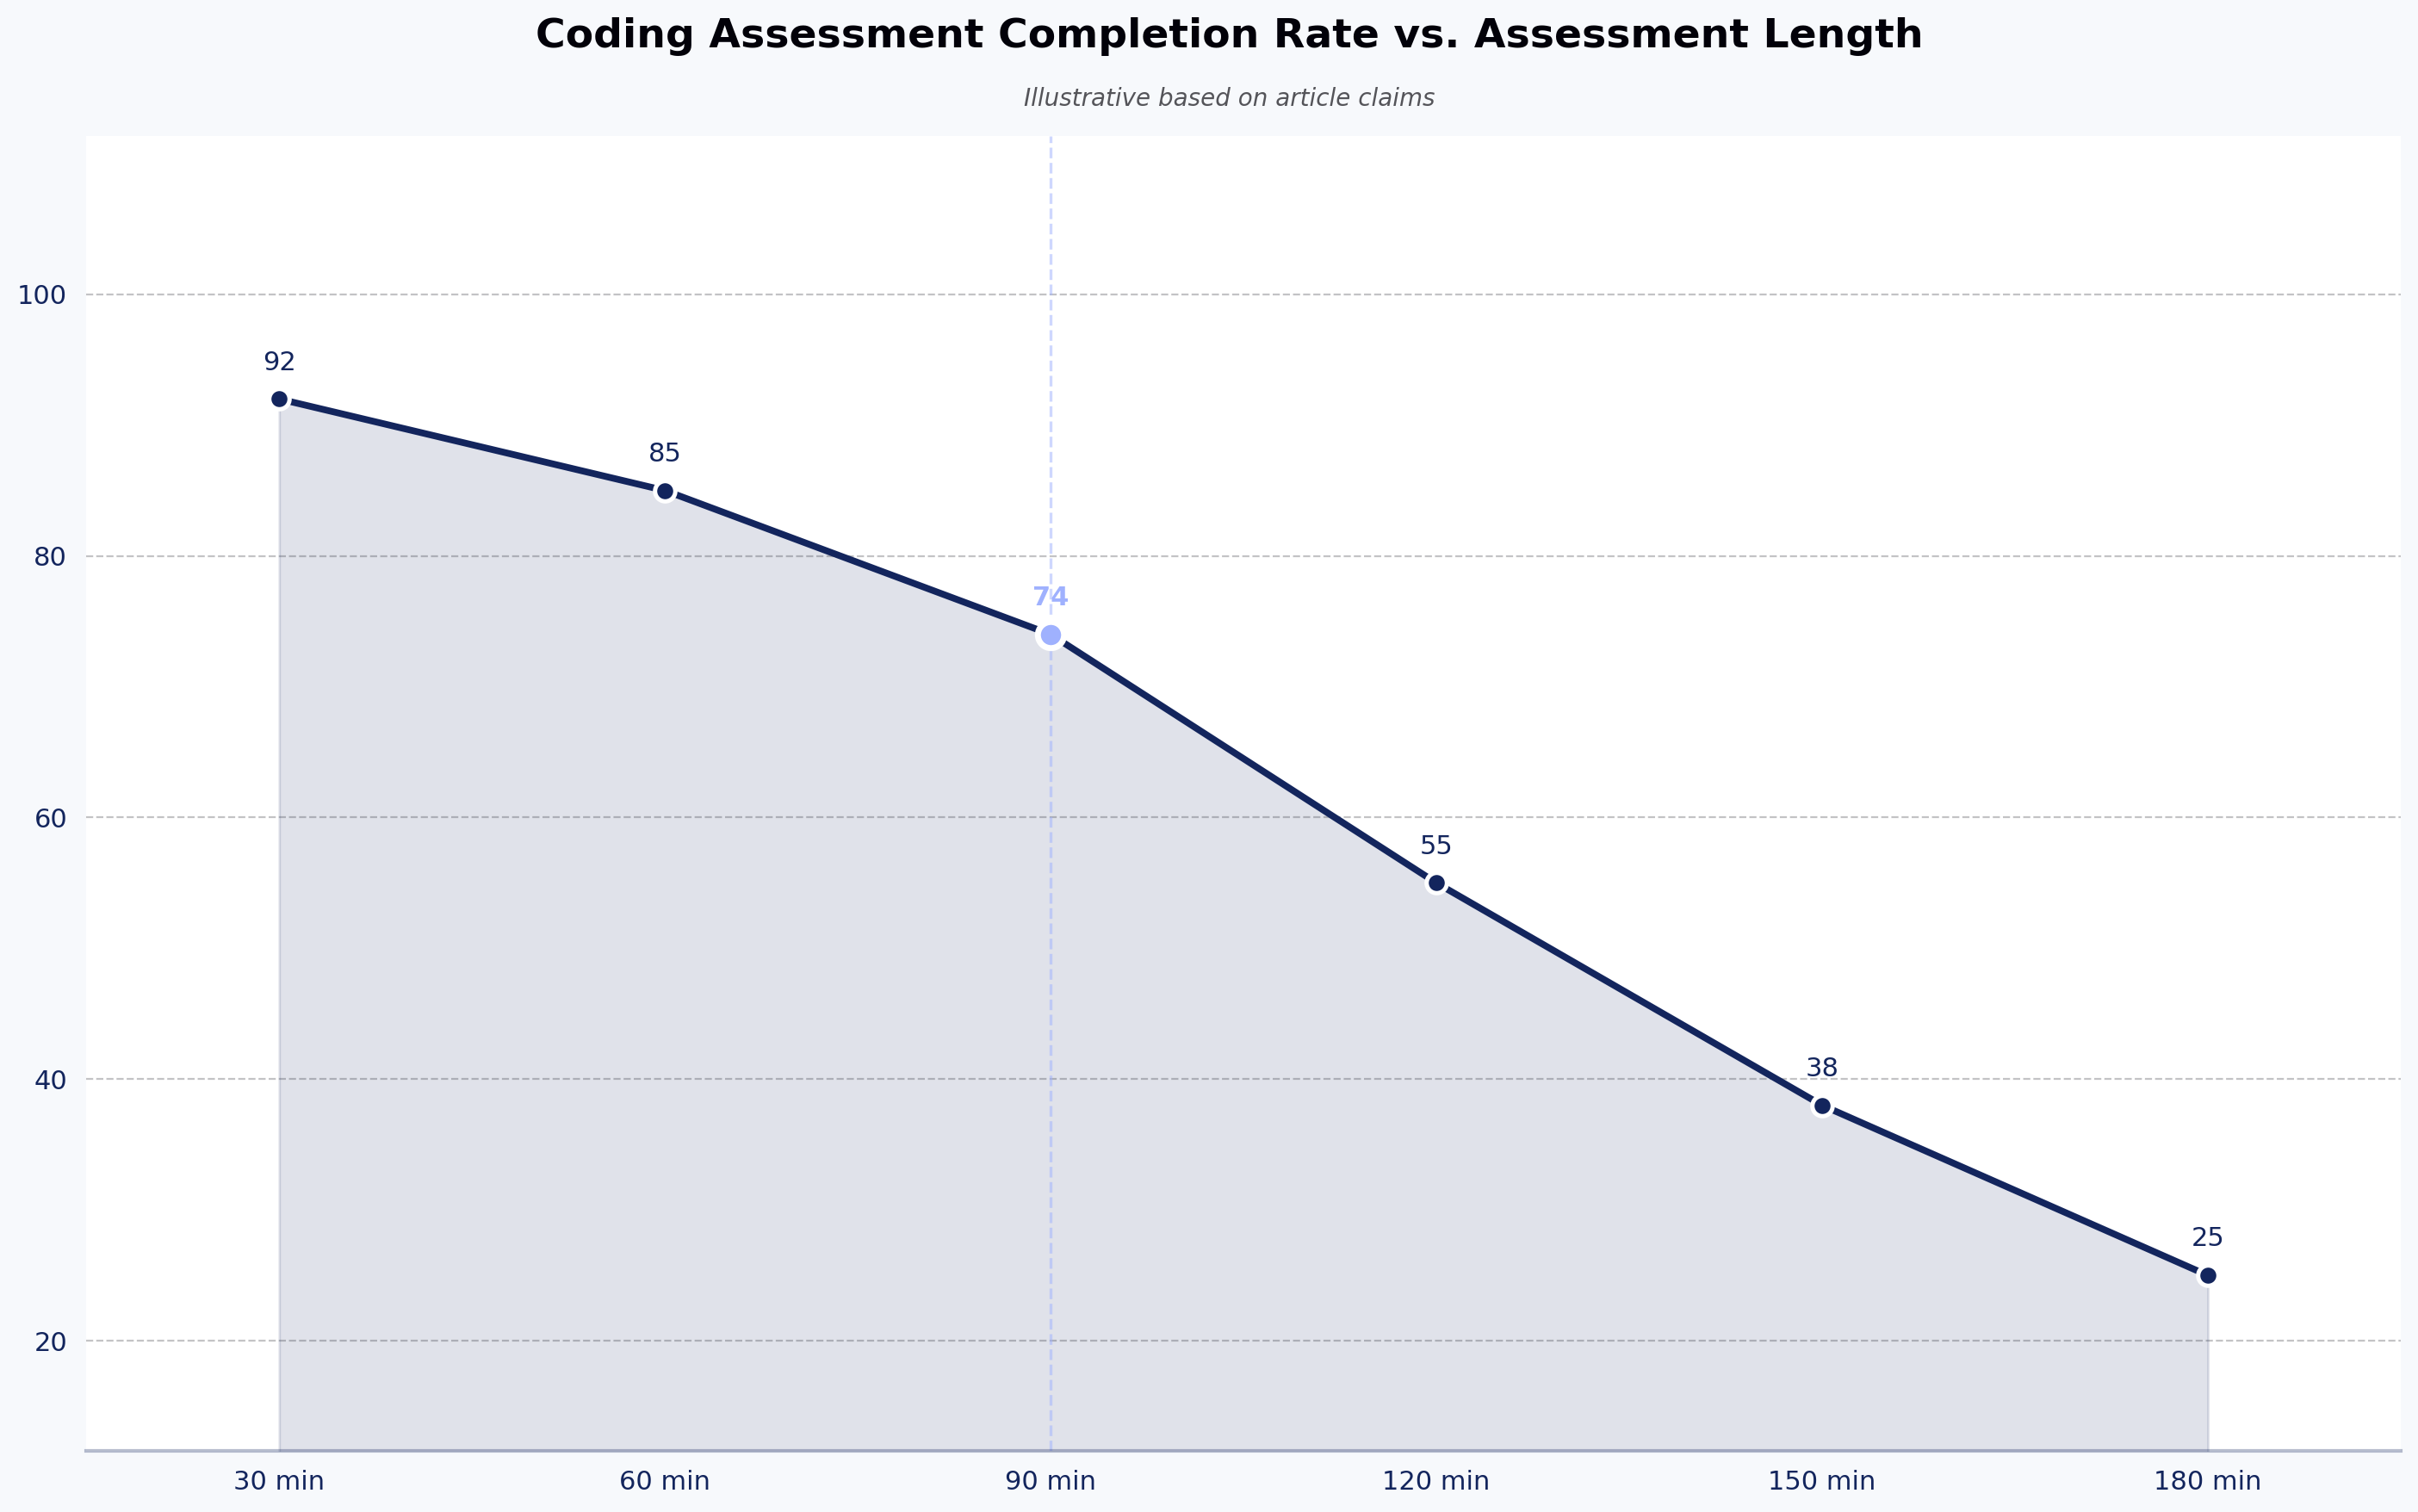
Application-stage drop-off above 60% is commonly observed in recruiting benchmarks and often signals form length or friction. Industry data consistently suggests that applications taking longer than 15 minutes see completion rates fall sharply, though the original source of that specific threshold is difficult to pin down.
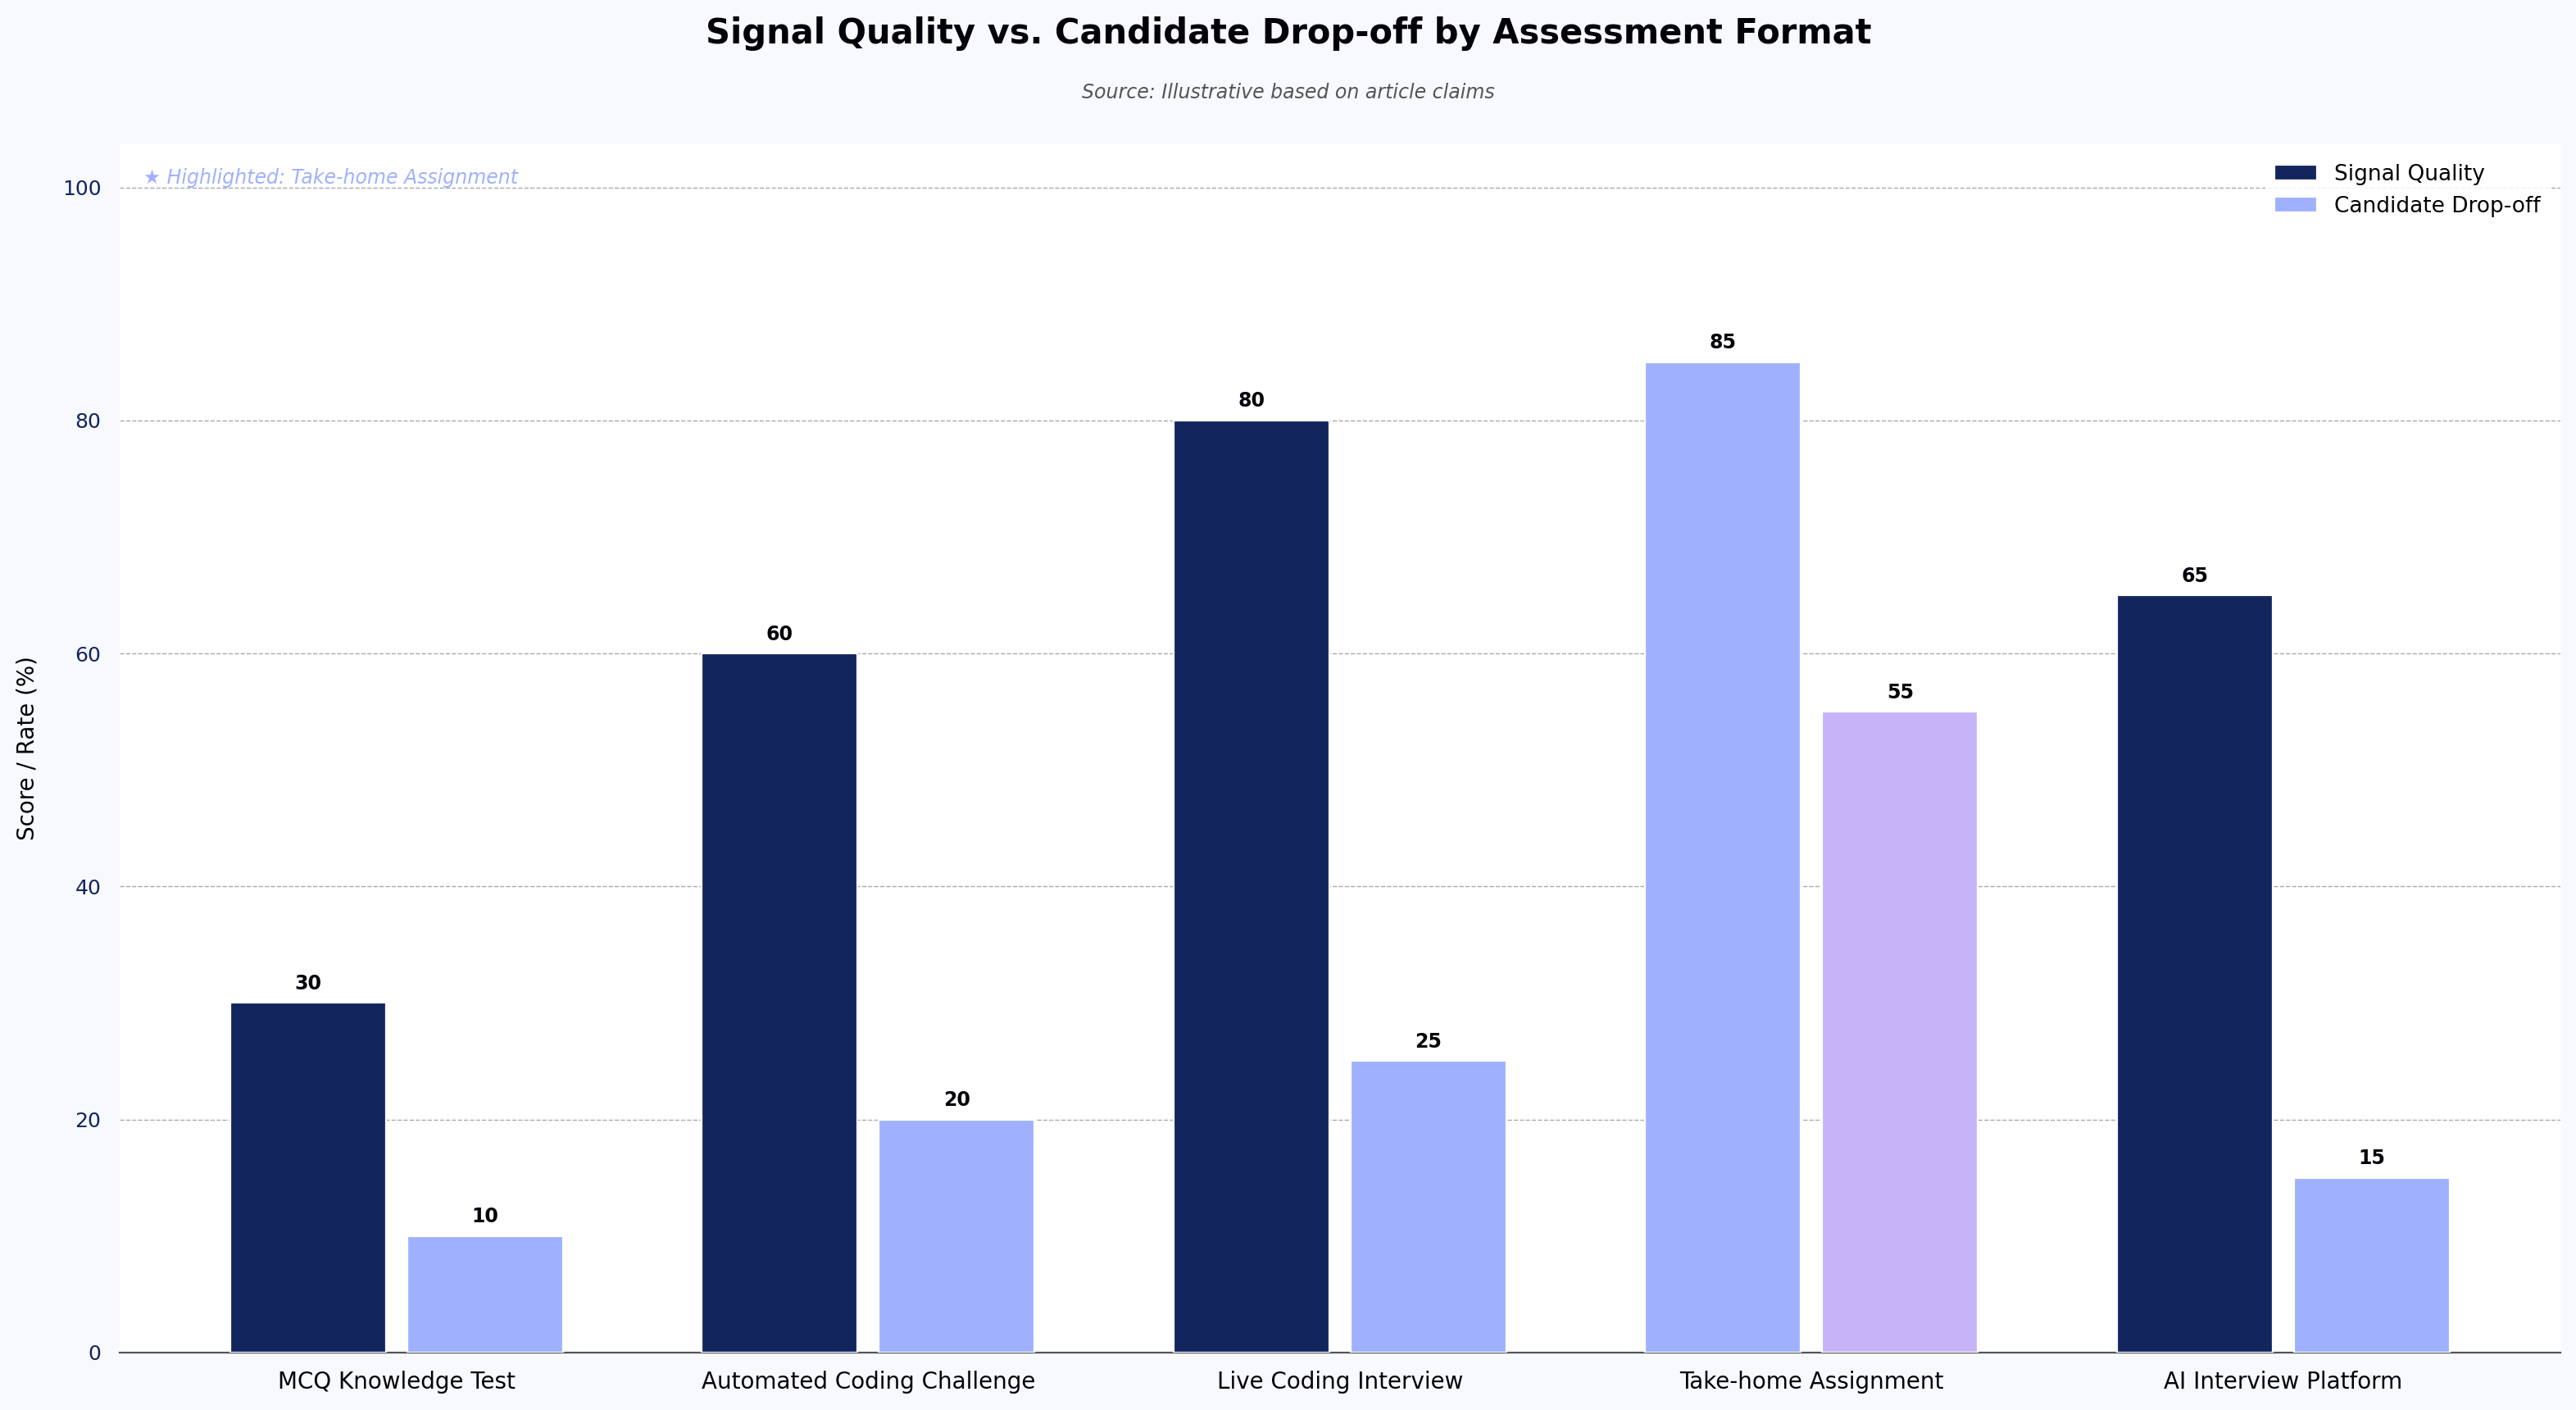
Concrete fixes: - Cut application forms to under 5 minutes. - Remove resume-plus-manual-entry duplication. - Enable mobile-first submissions. - Replace long take-home assignments with shorter, scored skill assessments.

Expert tips that lift acceptance rate and cut drop-off
These tips cut across the six metrics above and focus on cross-metric strategy — the levers that move more than one KPI at once.
- Define role fit before you open the requisition. Ambiguity between recruiter and hiring manager compounds through every stage — a shared rubric, salary band, and definition of success upstream is the single largest lever on interview-to-offer ratio downstream.
- Communication cadence beats communication volume. What matters is predictability: candidates should know when they will hear from you, even when the update is "no update." A candidate relationship management workflow can enforce a fixed rhythm at scale, and predictability shows up in cNPS more reliably than any single touchpoint.
- Treat scheduling as a signal, not a chore. When passive candidates hit friction booking a slot, no-show rates rise and acceptance rates fall in parallel. Self-scheduling with evening and early-morning options doubles as an employer-brand signal.
- Move as much evaluation upstream as possible. Job simulations and role-relevant tasks — the kind of structured skill evaluation HackerEarth's assessment platform surfaces automatically — lift acceptance rates because candidates see the work before they see the offer, and recruiters carry a defensible signal into every downstream conversation.
- Rejected candidates are a cNPS asset, not a liability. Because rejected candidates skew scores down disproportionately, a short and specific rejection note within a week is the highest-leverage segment-level intervention available.
Also read: Optimize your hiring process with recruitment analytics
Trade-offs worth acknowledging
Improving candidate experience metrics has costs. Faster time-to-hire can pressure interviewers into shortcuts. Investing in cNPS surveys, CRM tools, and structured assessments carries real budget. And in tight labor markets, even a strong candidate experience will not overcome a below-market compensation offer. Metrics are diagnostic — they surface where to invest, but they do not substitute for pay, role design, or manager quality.
FAQ
What is a good offer acceptance rate? Industry guidance commonly cites 85–90% as healthy for corporate roles, though this figure lacks a definitive primary source. A more useful frame: watch the trend line, and segment by role family and location. A stable 78% for a hard-to-fill engineering role in a competitive metro may be healthier than a 90% average pulled up by easy-to-fill roles.
How do you calculate candidate drop-off rate? The formula is exits ÷ entrants × 100 per stage. The more useful question is which stage to instrument first — most teams over-measure application drop-off (where the fixes are known) and under-measure post-offer withdrawal (where the fixes are usually compensation or manager reputation, and where the data is harder to surface).
What is a good candidate NPS score? Directional Talent Board benchmarks place strong cNPS above +50 and global averages in the +20 to +30 band, but a raw score is close to meaningless without segmentation. The counterintuitive move: track your rejected-candidate cNPS separately, because that segment drives most of the variance and is also where employer-brand damage compounds.
What is the average time-to-hire? LinkedIn's talent reporting has directionally placed medians around 33 days for engineering and 20–25 days for operations or sales, but internal benchmarks matter more than industry ones. Compare your engineering time-to-hire to your own six-month-ago figure, and compare it to the offer acceptance rate for the same cohort — cycle-time gains that cost you acceptance are not gains.
Which candidate experience metric matters most? Offer acceptance rate is the clearest downstream signal because it aggregates the effect of every earlier stage. But it is a lagging indicator — pair it with drop-off rate and cNPS to catch problems earlier.
Can automated tools eliminate hiring bias? No. Automated assessments and structured interviews can make evaluations more consistent across candidates, but they cannot guarantee fairness. Bias mitigation requires rubric design, interviewer calibration, and regular audits alongside tooling.
Next steps
If you want to compress time-to-hire and cut interview-to-offer ratio without sacrificing quality, start with the screen. Explore HackerEarth Assessments to see how replacing resume screening with structured skill evaluation shortens the funnel and raises the signal at every downstream stage.