Vasudhendra Badami

Author
Vasudhendra Badami

Blogs
With years spent in HR trenches, Vasudhendra is passionate about what makes organizations tick—people. Their writing dives deep into behavioral interviews, talent strategy, and employee experience.
author’s Articles

Insights & Stories by Vasudhendra Badami

Whether you're building your first team or scaling culture across regions, Vasudhendra Badami's articles offer human-first insights rooted in real practice.
Clear all
Thank you! Your submission has been received!
Oops! Something went wrong while submitting the form.
Filter
Filter

A tour of the Arduino UNO board

After understanding the hardware of the Arduino UNO board in the previous article, let's now get started with Arduino programming.

Arduino programs are written in the Arduino Integrated Development Environment (IDE). The Arduino IDE is software that lets you write sketches (Arduino programs) for various Arduino boards. The programming language is based on Processing, which resembles the C language. Once written, the sketch is uploaded to the board for execution.

The first step is downloading and installing the Arduino IDE, which is available for Windows, macOS, and Linux. Download the appropriate version from the official site and follow installation instructions.

Structure of Arduino Programs

Every Arduino program has at least two parts:

  • Preparation block – setup()
  • Execution block – loop()
void setup() {
  // initialization code
}

void loop() {
  // repeated execution code
}

setup() runs once when the program starts and is typically used to set pin modes or start serial communication. Even if unused, it must be defined.

void setup() {
  pinMode(pin_number, OUTPUT);
  pinMode(pin_number, INPUT);
}

loop() executes repeatedly after setup(). It's used to read inputs, write outputs, and handle logic.

void loop() {
  digitalWrite(pin_number, HIGH);  // turn on
  delay(1000);                     // wait 1 second
  digitalWrite(pin_number, LOW);   // turn off
  delay(1000);                     // wait 1 second
}

Note: Time is measured in milliseconds in Arduino.

Experiments

  • Blinking the LED
  • Fade-in and fade-out the LED

Components Required

  • Arduino UNO R3 – 1
  • Breadboard – 1
  • Breadboard connectors – 3
  • LED – 1
  • 1K resistor – 1

Blinking LED

Steps to build the circuit:

  1. Connect Arduino to system via USB cable.
  2. Connect digital pin 13 to breadboard positive rail; GND to negative.
  3. Use a 1K resistor between positive rail and terminal strip.
  4. Place LED in terminal strip below resistor.
  5. Connect LED cathode (short lead) to breadboard ground rail.
Circuit diagram of blinking LED with Arduino UNO

Code Version 1

int LED = 13;

void setup() {
  pinMode(LED, OUTPUT);
}

void loop() {
  digitalWrite(LED, HIGH);
  delay(1000);
  digitalWrite(LED, LOW);
  delay(1000);
}

Code Version 2

void setup() {
  pinMode(13, OUTPUT);
}

void loop() {
  digitalWrite(13, HIGH);
  delay(1000);
  digitalWrite(13, LOW);
  delay(1000);
}

Version 1 makes it easier to reuse or change pin numbers by using a variable.

Arduino IDE

Fade-In and Fade-Out LED

Note: Use pin 9 instead of pin 13 in this setup.

Circuit diagram for fade-in and fade-out with Arduino IDE

Code Version 1

int led = 9;
int brightness = 0;
int fade = 5;

void setup() {
  pinMode(led, OUTPUT);
}

void loop() {
  analogWrite(led, brightness);
  brightness = brightness + fade;

  if (brightness <= 0 || brightness >= 255) {
    fade = -fade;
  }
  delay(30);
}

Code Version 2

int led = 9;

void setup() {
  pinMode(led, OUTPUT);
}

void loop() {
  for (int fade = 0; fade <= 255; fade += 5) {
    analogWrite(led, fade);
    delay(30);
  }
}

analogWrite is used on PWM-capable digital pins to simulate analog output.

Next Steps: In the next article, we’ll explore conditional statements, loops, and analog/digital I/O in depth.

Congratulations! You've completed level-1 of Arduino programming. Move on to level-2 to keep learning!

Architecture of smart cities

Smart city services like smart water management, smart energy, smart mobility, smart buildings, etc., are based on a centralized system. A web of sensors spread across the city feeds data to this centralized system or control center by sensing activities in the physical environment. At the control center, the data is processed and stored as meaningful information. This information is shared across various departments of the city government for better coordination and data-driven decision-making.

This sounds pretty easy to implement, doesn't it?

But practically, it is not easy. Why?

Integrating various devices with different technologies with the existing communication infrastructure is one of the biggest challenges in developing a sustainable and efficient smart city.

ICT Architecture of a Smart City

The Information and Communication Technology (ICT) architecture of a smart city has four layers:

  • Sensing
  • Communication
  • Data
  • Service
Layered architecture of smart cities

Sensing Layer

This layer contains a varied set of IoT nodes deployed across an urban area. These nodes collect data about physical environment activities. An IoT node includes sensors, microchips, power supply, and network elements. Nodes are categorized as:

  • Constrained node: Operates in low-power environments with limited processing and data-transfer capabilities.
  • Unconstrained node: Has no constraints in power, processing, or data-transfer capabilities.

A node may function as constrained or unconstrained based on operational conditions. For example, a proximity sensor in a small office parking lot may be constrained, while the same in a large complex may be unconstrained.

Constrained nodes struggle with XML data due to overhead and parsing complexity. To address this, the W3C proposed the Efficient XML Interchange (EXI) format, which supports constrained devices.

EXI includes two encoding methods:

  • Schema-less encoding: Data is encoded directly and decoded without needing prior knowledge of the schema.
  • Schema-informed encoding: An XML schema is shared between processors, allowing optimized tag representation.

Schema-informed EXI enables constrained IoT nodes to become multipurpose by understanding and generating structured data formats efficiently.

Communication Layer

Every smart city system involves millions of IoT nodes. Each node requires a unique address, facilitated by IPv6 (128-bit address). However, IPv6 overhead is too high for constrained devices. Enter 6LoWPAN—a low-power protocol designed for these nodes.

Bridge routers convert IPv6 packets to 6LoWPAN and vice versa, enabling seamless communication.

Communication technologies include:

  • Unconstrained nodes: Wi-Fi, optic fiber, Ethernet, LTE, UMTS, and powerline communication.
  • Constrained nodes: IEEE 802.11 Low Power, Bluetooth Low Energy, IEEE 802.15.4, RFID, NFC, and PLC.

Data Layer

This is the intelligence layer of a smart city. It involves structured storage and processing of data from IoT nodes. Databases track:

  • All IoT nodes
  • Departments managing the nodes (e.g., water management)
  • Associated departmental data

Statistical models used include:

  • Predictive models: Analyze past and current data to forecast future events.
  • Descriptive models: Explain the relationship between events and their causes.
  • Decision models: Evaluate outcomes of decisions based on influencing factors.

ERP systems also play a role in managing interdepartmental data flows within this layer.

Service Layer

This cross-departmental layer integrates data from various city services (e.g., water, power, pollution, transport) through web and mobile applications. The layer supports not only internal government collaboration but also provides public access to subsets of data for transparency and innovation.

Many cities have addressed urban challenges successfully through smart technology. Notable examples include Barcelona, Tel Aviv, Amsterdam, Seoul, and Stockholm.

5 Mistakes to Avoid When Developing IoT Applications

It seems like just about everything is connected to the internet these days — or at least, on its way to being connected in some way. While adding a connected component to just about anything can make it more useful to the average consumer and help us live our lives better, when the IoT application isn’t developed appropriately, it can lead to more frustration and annoyance than usefulness.

With that in mind, it’s important to take your time when developing IoT applications and make sure you don’t overlook certain aspects that make the application work more efficiently. Making these simple mistakes can take your application from a great idea to a dud in no time at all, so be sure to avoid them.

Mistake #1: Not Using Existing Frameworks

When you develop an application for the IoT, there are typically four levels to consider: the device itself; the “ingestion layer,” or the infrastructure and software that collects the data and makes sense of it; the analytics layer, which takes the organized data and processes it; and finally, the end-user level, which is usually the actual app that the user interacts with.

In the case of a coffee maker, for example, the coffee maker is the thing itself, and is equipped with a microprocessor of some sort that collects the information that it’s time to make the coffee, adjust the amount of coffee, etc. The analytics layer takes that information and instructs the machine to conduct the task, adjusting as necessary, while all the user sees is the app that they can program to make one cup of French Roast at 6 a.m.

What does all of this have to do with using existing frameworks? Usually, developers only need to work within the analytics and end-user levels of the application development. There are development tools available that have already established the framework for the other levels, and by using them, you don’t need to reinvent the wheel. This not only makes it easier to develop new applications, but it also speeds up the time to market for new products.

Mistake #2: Forgetting About Scalability

How many people will be using your application on a typical day? While you can make predictions, you need to always be prepared for sudden load increases and fluctuations. Otherwise, you run the risk of interrupted or slow connectivity, which will reduce user satisfaction with your device. Therefore, when developing your application, you need to think about scalability, and be prepared for load switches and develop software that can be updated when necessary to accommodate the load without affecting user experience.

Mistake #3: Not Making Security a Priority

The security of the IoT is a hot topic these days, with many experts noting that the IoT is a prime target for hackers. While hacking, say, household appliances, hasn’t been a major issue yet, the potential is definitely there. For this reason, when developing your IoT application, you need to pay close attention to limiting the attack surface, keeping the app safe from code injection attacks, safeguarding any collected sensitive information, and planning for secure updates. Keeping security at the forefront of your application development ensures that your device won’t be the one that leads to a major attack or breach.

Mistake #4: Not Planning for the Future

There’s no denying that technology moves fast, and the potential for today’s technology to be obsolete within a few years is high. However, while you may not have a crystal ball for everything that is going to happen in the next five to ten years, there are some developments on the horizon that you want to pay attention to and plan for, since many IoT devices are not those that consumers are prepared to upgrade on a regular basis, such as refrigerators. For example, internet addresses are transitioning to IPv6 from IPv4. By planning your application for that change now, you can avoid a costlier update later.

Mistake #5: Not Hosting Appropriately

Finally, consider hosting your application in multiple data centers rather than a single location. This allows for reduced latency in response times, and ensures uninterrupted service in the event of a disaster. Users have little patience for sluggish response times or server errors.

Developing an IoT application for your device can help take it to the next level and increase customer satisfaction and brand loyalty — but only when the application is well developed. As you think about your next IoT project, remember these mistakes and your product won’t be in the “great idea, poor execution” hall of shame.

Barcelona: From a town in the Roman empire to a modern smart city

In the 3rd century BC, the Carthaginian conqueror Hamilcar Barca established a settlement on the mouth of the rivers Llobregat and Besòs. He named it Barcino after his family. In the 15th century BC, Romans conquered Barcino and used it as their military base. As time passed, Barcino became popular as Barcelona.

Barcelona is the second-largest city in Spain with a population of 1.8 million inhabitants. It is a compact city with an ever-increasing population. There were certain factors that were hindering normal life, such as:

  • Traffic congestion
  • Noise pollution
  • Bad drainage system
  • Insufficient local transport system
  • Inefficient waste management
  • Unavailability of parking space, and more

In 2012, the city government of Barcelona found a solution for these problems in a project that was undertaken 30 years ago. The project was to network 2 municipal buildings with an optical fiber network. This sparked the idea of building a smart city under the umbrella of Smart City Barcelona. The technology infrastructure of Smart City Barcelona is built on top of this optical fiber network called Transversal. Currently, Barcelona is connected with an optical fiber network of a whopping 500 km!

Building Smart City Barcelona

So just how was the ambitious goal of converting "Barcelona, a heritage city" to "Barcelona, a smart city" accomplished?

To start with, the Barcelona city government divided the Smart City Barcelona project into 22 programs comprising 83 individual projects. These projects were chosen such that it addressed all the factors that were hindering normal life in Barcelona.

The approach for smart city Barcelona is the idea that the city would function as a network of networks. In this way, it could connect different individual networks in the city, for example, transportation, pollution board, technology etc.

Barcelona city government structured its various smart city projects in the following 3 technology layers:

Layer 1: Sensors to sense activities in the environment

The government has installed a sensor platform called “Sentilo”. Considering the potential of the platform, the city government has made the Sentilo platform open source and the repository is available on Github. This will enable anyone in the world to use the platform to build their own applications.

The sensors are deployed across the city based on the requirements of the projects. These sensors are used to monitor and detect changes in the environment, for example, changes in the pollution level in a specific area.

Layer 2: City OS

City OS is the key for unlocking IoT benefits associated with data analytics and predictive modeling. It aggregates the data from various city applications and Sentilo and analyses it. For example, using the data collected from Sentilo about the pollution level, City OS can create a graphical visualization. It can also predict the pollution level for the rest of the week. This mechanism helps the Pollution Control Board to take proactive measures.

Layer 3: Service layer for data sharing

The third layer is a service layer that is used for sharing the data and analytics that are collected from the City OS layer. This data can be used by the public to enhance the city services and operations. For example, with the data and predictions available at the City OS layer, application developers can build a mobile app. This app can be used to alert users about the pollution levels and recommend appropriate measures.

Transit system

Transports Metropolitans de Barcelona (TMB) has introduced an innovative orthogonal bus network (horizontal, vertical, and diagonal lines) with hybrid buses. With this initiative the buses are now faster, frequent, and easy-to-use.

The goal of TMB’s orthogonal bus network is to ensure that travelers make just one transfer between any two points to cover 95% of their journeys. To achieve this objective, TMB has 16 orthogonal bus lines. This ensures that all parts of the Barcelona are covered. With this improved geographical coverage, the distance from any point in the city to nearest bus stop is less than 400 m.

Hybrid buses in Barcelona

Orthogonal transit network

Smart bus stop in Barcelona

Impact

  • Bus frequency increased from 12 min to 5 min
  • Travelers can reach any part of Barcelona in less than 40 min
  • Travelers can save ~10 million hours annually
  • CO2 emission reduced by 5000 tons/year
  • Construction cost is recovered in just 2 years through reduction in operational cost

Rainwater harvesting system

Barcelona City Council came up with a mega project of constructing 33 underground water-retention tanks with a total capacity of 1,168,900 m³. The water retention tanks have 18 gates, which are controlled from a remote control station.

Rainwater retention tank

Impact

  • Prevented more than 940 tons of suspended matter from joining the sea
  • Saved 3.7 million m³ rainwater from flowing into the sea annually
  • Barcelona is now a robust flood-resistant city

Bicycle sharing system

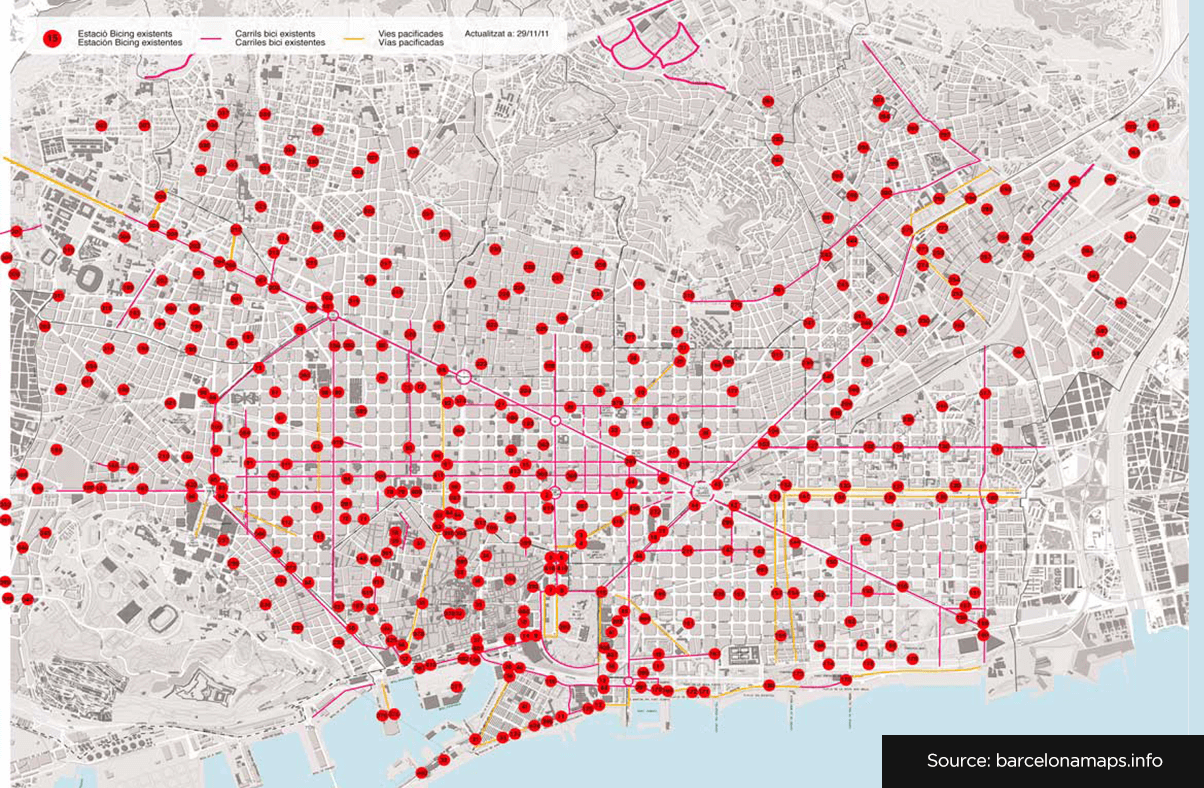
Barcelona City Council introduced Bicing, a bicycle-sharing system, with an objective to provide a sustainable mode of transportation and to address traffic-congestion issues.

Bicing is an on-street scheme available all year round. Riders use an RFID swipe card to unlock a bike. There are 420 Bicing stations in the city with a capacity of 20 bicycles each, located near public transport stops to facilitate intermodal use.

Bicing station

Bicing stations in Barcelona

Impact

  • Acquired 99,600 subscribers
  • Each bike is used 7.5 times a day (~1.4 million journeys/month)
  • Average ride time is 13 min
  • Reduces CO2 emission by 4000 tons annually

Power generation and distribution network

The Barcelona City Council in association with other private players has established 2 power generation units in Forum and 22@.

The plants use steam from incinerated urban waste and store excess energy using an advanced ice storage system. Energy is distributed through a network of hot and cold water piping systems.

Impact

  • Decreased fossil fuel dependency by 22%
  • Reduced CO2 emission by 17,000 tons annually

The Smart City Barcelona project has not only increased the revenue for the city government but also created 47,000 new jobs. While countries are still sceptical of implementing IoT, Barcelona has demonstrated how smart cities make economic sense while solving problems like pollution and global warming.

Read this article for a detailed description about the Information and Communications Technology (ICT) architecture of smart cities.

What is a fitness tracker and how does it work?

I’m waiting for the bus outside this store that’s displaying fantastic workout clothes. I sigh and then turn my head to see a billboard about a new gym in town. I’m torn between guilt, for not exercising ever, and surprise at the shiny pennies people are apparently willing to shell out to get be fit and stylish. The bus comes by, I manage to squeeze into a seat, and then I open my magazine to a page where the article is titled “This Is the Compelling Science behind Fitness Trackers.” The universe is telling me something, isn’t it?

I’m inspired enough to pen this article where I’ll talk about different sensors that make activity trackers tick.

Mini labs juggling complex data—fitness trackers

It looks like a watch. It looks like a smartphone. It is so much more…

Then there is an Apple Watch vs. Fitbit Blaze debate going on.

Fitbit Blaze Apple Watch
Fitbit and Apple are two of the most popular fitness tracker manufacturers (Source)

This wearable is a wrist-based monitor with sensors that tell you if you’ve been walking enough, sleeping and eating enough, jogging or sprinting, staying out too long in the sun, and it tracks a whole lot of other stuff to keep you as healthy as you can be.

Research might scare you into buying one

Do you know what WHO says? Every year, 38 million people die from noncommunicable diseases globally and cardiovascular diseases account for the most. It’s a wonder we don’t wear an activity band on each hand.

Although you can’t peg heart rate monitors as indicators of potentially fatal diseases, ensuring that you’ve lowered your resting heart rate is a valuable wellness/fitness metric. (Source)

These words—obesity, diabetes, physical inactivity, smoking, alcohol, salt, blood pressure, cholesterol, and sleep patterns—figure largely in reports related to health and articles about the changing lifestyles of millennials. So, do we need these wearable digital monitors? Hell, yeah!

Unravelling the mystery of these tiny marvels

Some people think that the system complexity of fitness trackers is much lesser than a full-blown smart watch. But I disagree. A fitness tracker is some sort of a genius companion you ought to have.

5 layer architecture of a fitness tracker

Getting down to the details...

  • Sensing layer: Collects data like footsteps, heart rate, temperature, etc., and sends it via GSM/GPRS/LTE.
  • MAC Layer: Manages device control, quality-of-service, and power.
  • Network layer: Handles transmission using IPV6.
  • Processing and storage layer: Analyzes and stores sensor data with security control.
  • Service layer: Delivers processed data to apps and services.

Now, let's take a close look at a few of these sensors...

Accelerometers

They measure acceleration forces to track motion, orientation, and direction—used in smartphones, rockets, and fitness bands.

How does Accelerometer work

Here’s a great video on how your iPhone knows up from down.

GPS

Fitness tracker GPS
The GPS plays an important role in a fitness tracker (Source)

Used for location tracking via satellite signals and trilateration. Essential for route tracking and emergency alerts.

Galvanic Skin Response Sensor

Measures electrical conductance of the skin. Tracks emotion-based sweating, aiding stress and fitness insights.

Output-1 of Galvanic Skin Response Sensor Output -2 of Galvanic Skin Response Sensor Output-3 of Galvanic Skin Response Sensor

Optical Heart Rate Monitor (OHRM)

Uses photoplethysmography to detect heart rate by shining light on skin and measuring changes in light absorption.

Optical Heart Rate Monitor
Source

Bioimpedance Sensors

working of a bio-impedance sensor

Measures resistance to current to determine heart rate, respiration, hydration, and more.

How does Bioimpedance sensors works

Temperature Sensors

Monitor body temperature for health insights. Crucial for athlete recovery and early detection of anomalies.

UV and Ambient Light Sensors

Help track sun exposure and adjust brightness/time metrics for user interface and circadian data.

Finding the right fitness tracker

Choose based on features—heart rate, sleep tracking, calorie counting, and more. Here are top options:

Garmin Vivosmart HR+ – Heart rate, sleep, steps, waterproof.

Garmin Vivosmart HR+ App

Fitbit Charge 2 – Tracks wellness, breathing, and activity.

Fitbit Charge 2 App

Jawbone UP4 – Measures heart rate, breath, sweat via Bioimpedance.

Samsung Gear Fit2 – Built-in GPS, activity auto-detection.

Other good bands: Withings Go, Microsoft Band 2, Basis Peak, Moov Now, Misfit Ray.

While no sensor is perfect, fitness trackers are getting smarter and more accurate. Use them right and they’ll lead you to a healthier life.