Tech Tutorials

Thank you! Your submission has been received!
Oops! Something went wrong while submitting the form.

How can R Users Learn Python for Data Science ?

Introduction

The best way to learn a new skill is by doing it!

This article is meant to help R users enhance their set of skills and learn Python for data science (from scratch). After all, R and Python are the most important programming languages a data scientist must know.

Python is a supremely powerful and a multi-purpose programming language. It has grown phenomenally in the last few years. It is used for web development, game development, and now data analysis / machine learning. Data analysis and machine learning is a relatively new branch in python.

For a beginner in data science, learning python for data analysis can be really painful. Why?

You try Googling "learn python," and you'll get tons of tutorials only meant for learning python for web development. How can you find a way then?

In this tutorial, we'll be exploring the basics of python for performing data manipulation tasks. Alongside, we'll also look how you do it in R. This parallel comparison will help you relate the set of tasks you do in R to how you do it in python! And in the end, we'll take up a data set and practice our newly acquired python skills.

Note: This article is best suited for people who have a basic knowledge of R language.

Machine learning challenge, ML challenge

Table of Contents

  1. Why learn Python (even if you already know R)
  2. Understanding Data Types and Structures in Python vs. R
  3. Writing Code in Python vs. R
  4. Practicing Python on a Data Set

Why learn Python (even if you already know R)

No doubt, R is tremendously great at what it does. In fact, it was originally designed for doing statistical computing and manipulations. Its incredible community support allows a beginner to learn R quickly.

But, python is catching up fast. Established companies and startups have embraced python at a much larger scale compared to R.

r machine learning vs python machine learning

According to indeed.com (from Jan 2016 to November 2016), the number of job postings seeking "machine learning python" increased much faster (approx. 123%) than "machine learning in R" jobs. Do you know why? It is because

  1. Python supports the entire spectrum of machine learning in a much better way.
  2. Python not only supports model building but also supports model deployment.
  3. The support of various powerful deep learning libraries such as keras, convnet, theano, and tensorflow is more for python than R.
  4. You don't need to juggle between several packages to locate a function in python unlike you do in R. Python has relatively fewer libraries, with each having all the functions a data scientist would need.

Understanding Data Types and Structures in Python vs. R

These programming languages understand the complexity of a data set based on its variables and data types. Yes! Let's say you have a data set with one million rows and 50 columns. How would these programming languages understand the data?

Basically, both R and Python have pre-defined data types. The dependent and independent variables get classified among these data types. And, based on the data type, the interpreter allots memory for use. Python supports the following data types:

  1. Numbers – It stores numeric values. These numeric values can be stored in 4 types: integer, long, float, and complex.
    • Integer – Whole numbers such as 10, 13, 91, 102. Same as R's integer type.
    • Long – Long integers in octa and hexadecimal. R uses bit64 package for hexadecimal.
    • Float – Decimal values like 1.23, 9.89. Equivalent to R's numeric type.
    • Complex – Numbers like 2 + 3i, 5i. Rarely used in data analysis.
  2. Boolean – Stores two values (True and False). R uses factor or character. Case-sensitive difference exists: R uses TRUE/FALSE; Python uses True/False.
  3. Strings – Stores text like "elephant", "lotus". Same as R's character type.
  4. Lists – Like R’s list, stores multiple data types in one structure.
  5. Tuples – Similar to immutable vectors in R (though R has no direct equivalent).
  6. Dictionary – Key-value pair structure. Think of keys as column names, values as data entries.

Since R is a statistical computing language, all the functions to manipulate data and reading variables are available inherently. On the other hand, python hails all the data analysis / manipulation / visualization functions from external libraries. Python has several libraries for data manipulation and machine learning. The most important ones are:

  1. Numpy – Used for numerical computing. Offers math functions and array support. Similar to R’s list or array.
  2. Scipy – Scientific computing in python.
  3. Matplotlib – For data visualization. R uses ggplot2.
  4. Pandas – Main tool for data manipulation. R uses dplyr, data.table.
  5. Scikit Learn – Core library for machine learning algorithms in python.

In a way, python for a data scientist is largely about mastering the libraries stated above. However, there are many more advanced libraries which people have started using. Therefore, for practical purposes you should remember the following things:

  1. Array – Similar to R's list, supports multidimensional data with coercion effect when data types differ.
  2. List – Equivalent to R’s list.
  3. Data Frame – Two-dimensional structure composed of lists. R uses data.frame; python uses DataFrame from pandas.
  4. Matrix – Multidimensional structure of same class data. In R: matrix(); in python: numpy.column_stack().

Until here, I hope you've understood the basics of data types and data structures in R and Python. Now, let's start working with them!

Writing Code in Python vs. R

Let's use the knowledge gained in the previous section and understand its practical implications. But before that, you should install python using Anaconda's Jupyter Notebook. You can download here. Also, you can download other python IDEs. I hope you already have R Studio installed.

1. Creating Lists

In R:

my_list <- list('monday','specter',24,TRUE)
typeof(my_list)
[1] "list"

In Python:

my_list = ['monday','specter',24,True]
type(my_list)
list

Using pandas Series:

import pandas as pd
pd_list = pd.Series(my_list)
pd_list
0     monday
1    specter
2         24
3       True
dtype: object

Python uses zero-based indexing; R uses one-based indexing.

2. Matrix

In R:

my_mat <- matrix(1:10, nrow = 5)
my_mat
     [,1] [,2]
[1,]    1    6
[2,]    2    7
[3,]    3    8
[4,]    4    9
[5,]    5   10

# Select first row
my_mat[1,]

# Select second column
my_mat[,2]

In Python (using NumPy):

import numpy as np
a = np.array(range(10,15))
b = np.array(range(20,25))
c = np.array(range(30,35))
my_mat = np.column_stack([a, b, c])

# Select first row
my_mat[0,]

# Select second column
my_mat[:,1]

3. Data Frames

In R:

data_set <- data.frame(Name = c("Sam","Paul","Tracy","Peter"),
                       Hair_Colour = c("Brown","White","Black","Black"),
                       Score = c(45,89,34,39))

In Python:

data_set = pd.DataFrame({'Name': ["Sam","Paul","Tracy","Peter"],
                         'Hair_Colour': ["Brown","White","Black","Black"],
                         'Score': [45,89,34,39]})

Selecting columns:

In R:

data_set$Name
data_set[["Name"]]
data_set[1]

data_set[c('Name','Hair_Colour')]
data_set[,c('Name','Hair_Colour')]

In Python:

data_set['Name']
data_set.Name
data_set[['Name','Hair_Colour']]
data_set.loc[:,['Name','Hair_Colour']]

Practicing Python on a Data Set

import numpy as np
import pandas as pd
from sklearn.datasets import load_boston

boston = load_boston()

boston.keys()
['data', 'feature_names', 'DESCR', 'target']

print(boston['feature_names'])
['CRIM' 'ZN' 'INDUS' 'CHAS' 'NOX' 'RM' 'AGE' 'DIS' 'RAD' 'TAX' 'PTRATIO' 'B' 'LSTAT']

print(boston['DESCR'])
bos_data = pd.DataFrame(boston['data'])
bos_data.head()

bos_data.columns = boston['feature_names']
bos_data.head()

bos_data.describe()

# First 10 rows
bos_data.iloc[:10]

# First 5 columns
bos_data.loc[:, 'CRIM':'NOX']
bos_data.iloc[:, :5]

# Filter rows
bos_data.query("CRIM > 0.05 & CHAS == 0")

# Sample
bos_data.sample(n=10)

# Sort
bos_data.sort_values(['CRIM']).head()
bos_data.sort_values(['CRIM'], ascending=False).head()

# Rename column
bos_data.rename(columns={'CRIM': 'CRIM_NEW'})

# Column means
bos_data[['ZN','RM']].mean()

# Transform numeric to categorical
bos_data['ZN_Cat'] = pd.cut(bos_data['ZN'], bins=5, labels=['a','b','c','d','e'])

# Grouped sum
bos_data.groupby('ZN_Cat')['AGE'].sum()

# Pivot table
bos_data['NEW_AGE'] = pd.cut(bos_data['AGE'], bins=3, labels=['Young','Old','Very_Old'])
bos_data.pivot_table(values='DIS', index='ZN_Cat', columns='NEW_AGE', aggfunc='mean')

Summary

While coding in python, I realized that there is not much difference in the amount of code you write here; although some functions are shorter in R than in Python. However, R has really awesome packages which handle big data quite conveniently. Do let me know if you wish to learn about them!

Overall, learning both the languages would give you enough confidence to handle any type of data set. In fact, the best part about learning python is its comprehensive documentation available on numpy, pandas, and scikit learn libraries, which are sufficient enough to help you overcome all initial obstacles.

In this article, we just touched the basics of python. There's a long way to go. Next week, we'll learn about data manipulation in python in detail. After that, we'll look into data visualization, and the powerful machine learning library in python.

Do share your experience, suggestions, and questions below while practicing this tutorial!

17 open source IoT projects to work on in 2017

2017 is round the corner

...and it's time to build a checklist of New Year resolutions. And I am sure one resolution is common among all the IoT developers — contributing to open source IoT projects. If you are looking for interesting open source IoT projects to contribute to, I have compiled a list of 17 open source IoT projects where you can find something interesting to work on!

  1. Eclipse Kura
  2. Eclipse Kura is a platform for building IoT gateways. It enables remote management of gateways and provides APIs for writing and deploying your own IoT applications. It runs on Java Virtual Machine and uses OSGi. APIs offered by Eclipse Kura give easy access to underlying hardware such as serial ports, GPS, watchdog, USB, GPIOs, and I2C. Eclipse Kura simplifies network configuration, communication with servers, and remote gateway management with the help of OSGi bundles.

    Languages: Java, HTML, C, Shell, C++, JavaScript
    License: Eclipse Public License - v 1.0

    Find Eclipse Kura on Github

  3. ThingSpeak
  4. ThingSpeak is an IoT platform and API for data collection and analytics. It serves as a bridge connecting edge node devices with data analysis tools.

    It supports numeric data processing such as:

    • Time scaling
    • Averaging
    • Median
    • Summing
    • Rounding

    ThingSpeak also integrates with MATLAB.

    Languages: Ruby, HTML, JavaScript, CSS
    License: GPL Version 3

    Find ThingSpeak on Github

  5. Zetta
  6. Zetta is a platform for creating IoT servers running across geo-distributed computers and cloud. Built on Node.js, it uses REST APIs, WebSockets, and reactive programming. Zetta can turn any device into an API and works with microcontrollers like Arduino and Spark Core.

    Languages: JavaScript, Shell
    License: MIT

    Find Zetta on Github

  7. Open Hybrid
  8. Watch Video

    Open Hybrid is a platform that combines physical objects with augmented UIs via mobile/tablet interfaces. It lets users interact with everyday devices using virtual controls.

    Languages: JavaScript, C++, C
    License: Mozilla Public License 2.0

    Find Open Hybrid on Github

  9. Casa Jasmina
  10. Watch Video

    Casa Jasmina is an open source smart home project combining Italian interior design with open-source electronics. Conceptualized by Bruce Sterling, it's designed as a smart apartment prototype.

    Languages: Arduino, JavaScript, C, PHP, Shell
    License: GNU LGPL v2.1

    Find Casa Jasmina on Github

  11. Node-RED
  12. Node-RED is a visual tool for connecting hardware devices, APIs, and services. It includes a browser-based editor and built-in library, ideal for quick IoT app development. Built on Node.js.

    Languages: JavaScript, HTML, CSS
    License: Apache License V2.0

    Find Node-RED on Github

  13. Wio Link
  14. Watch Video

    Wio Link is an ESP8266-based Wi-Fi development board. No soldering or breadboards needed — you use a mobile app to create RESTful API-based IoT projects.

    Languages: C, C++, Python, HTML
    License: GNU GPL v3

    Find Wio Link on Github

  15. OpenThread
  16. OpenThread is Nest Labs’ open-source implementation of the Thread protocol, focused on secure and reliable smart home device communication.

    Languages: C++, Python, C, Makefile, M4, C#
    License: BSD-3-Clause

    Find OpenThread on Github

  17. Macchina.io
  18. Macchina.io is a toolkit for creating embedded IoT applications, combining JavaScript and C++ with support for Raspberry Pi and other Linux-based platforms.

    Languages: C++, C, Objective-C, Makefile, HTML, Shell
    License: Apache License V2.0

    Find Macchina.io on Github

  19. The Physical Web
  20. Watch Video

    This project enables smart objects to broadcast URLs using BLE beacons. Mobile users can discover and interact with objects nearby through web links without installing apps.

    Languages: Java, Objective-C, Python, HTML, Shell
    License: Apache License V2.0

    Find The Physical Web on Github

  21. DragonBoard™ 410c
  22. First development board using Snapdragon 400 series. Supports Android, Debian, and Windows 10 IoT Core. Ideal for rapid development of IoT products like:

    • Robotics
    • Cameras
    • Medical Devices
    • Vending Machines
    • Smart Buildings
    • Digital Signage
    • Casino Gaming Consoles

  23. Netbeast
  24. Netbeast is an environment-agnostic IoT platform enabling inter-device communication across different brands using plugins and a universal API.

    Languages: JavaScript, HTML, Shell, Java, CSS
    License: GNU Public License

    Find Netbeast on Github

  25. Ubuntu Core Snappy
  26. A lightweight OS for IoT, featuring "snaps" — transactional app packages that enable secure, upgradable systems for a variety of boards.

    Languages: Shell, Go, Python, C++, C

    Find Ubuntu Core Snappy on Github

  27. IoTivity
  28. IoTivity enables secure communication between connected devices across different OS and network types. Backed by Samsung and Intel.

    Languages: C++, C, Shell, JavaScript, Python
    License: Apache License V2.0

    Find IoTivity on Github

  29. AllJoyn (AllSeen Alliance)
  30. AllJoyn provides an open framework for devices to discover, communicate, and collaborate regardless of vendor or OS. Led by Qualcomm.

    Languages: C, C++, Java, Objective-C, JavaScript
    License: Creative Commons

    Find AllJoyn on Github

  31. FarmBot
  32. Watch Video

    FarmBot is a drag-and-drop tool for automated gardening. Comes with a kit containing motors, belts, nozzles, and a Raspberry Pi 3.

  33. Kaa Project
  34. Kaa is a powerful IoT platform for building and managing applications, offering features like configurable messaging and endpoint profiles.

    Languages: Java, C, Objective-C, C++, Python, Shell
    License: Apache License V2.0

    Find Kaa Project on Github

Linus Torvalds quote on source freedom

Practical Guide to Logistic Regression Analysis in R

Introduction

Recruiters in the analytics/data science industry expect you to know at least two algorithms: Linear Regression and Logistic Regression. I believe you should have in-depth understanding of these algorithms. Let me tell you why.

Due to their ease of interpretation, consultancy firms use these algorithms extensively. Startups are also catching up fast. As a result, in an analytics interview, most of the questions come from linear and Logistic Regression.

In this article, you'll learn Logistic Regression in detail. Believe me, Logistic Regression isn't easy to master. It does follow some assumptions like Linear Regression. But its method of calculating model fit and evaluation metrics is entirely different from Linear/Multiple regression.

But, don't worry! After you finish this tutorial, you'll become confident enough to explain Logistic Regression to your friends and even colleagues. Alongside theory, you'll also learn to implement Logistic Regression on a data set. I'll use R Language. In addition, we'll also look at various types of Logistic Regression methods.

Note: You should know basic algebra (elementary level). Also, if you are new to regression, I suggest you read how Linear Regression works first.

Table of Contents

  1. What is Logistic Regression ?
  2. What are the types of Logistic Regression techniques ?
  3. How does Logistic Regression work ?
  4. How can you evaluate Logistic Regression's model fit and accuracy ?
  5. Practical - Who survived on the Titanic ?
Machine learning challenge, ML challenge

What is Logistic Regression ?

Many a time, situations arise where the dependent variable isn't normally distributed; i.e., the assumption of normality is violated. For example, think of a problem when the dependent variable is binary (Male/Female). Will you still use Multiple Regression? Of course not! Why? We'll look at it below.

Let's take a peek into the history of data analysis.

So, until 1972, people didn't know how to analyze data which has a non-normal error distribution in the dependent variable. Then, in 1972, came a breakthrough by John Nelder and Robert Wedderburn in the form of Generalized Linear Models. I'm sure you would be familiar with the term. Now, let's understand it in detail.

Generalized Linear Models are an extension of the linear model framework, which includes dependent variables which are non-normal also. In general, they possess three characteristics:

  1. These models comprise a linear combination of input features.
  2. The mean of the response variable is related to the linear combination of input features via a link function.
  3. The response variable is considered to have an underlying probability distribution belonging to the family of exponential distributions such as binomial distribution, Poisson distribution, or Gaussian distribution. Practically, binomial distribution is used when the response variable is binary. Poisson distribution is used when the response variable represents count. And, Gaussian distribution is used when the response variable is continuous.

Logistic Regression belongs to the family of generalized linear models. It is a binary classification algorithm used when the response variable is dichotomous (1 or 0). Inherently, it returns the set of probabilities of target class. But, we can also obtain response labels using a probability threshold value. Following are the assumptions made by Logistic Regression:

  1. The response variable must follow a binomial distribution.
  2. Logistic Regression assumes a linear relationship between the independent variables and the link function (logit).
  3. The dependent variable should have mutually exclusive and exhaustive categories.

In R, we use glm() function to apply Logistic Regression. In Python, we use sklearn.linear_model function to import and use Logistic Regression.

Note: We don't use Linear Regression for binary classification because its linear function results in probabilities outside [0,1] interval, thereby making them invalid predictions.

What are the types of Logistic Regression techniques ?

Logistic Regression isn't just limited to solving binary classification problems. To solve problems that have multiple classes, we can use extensions of Logistic Regression, which includes Multinomial Logistic Regression and Ordinal Logistic Regression. Let's get their basic idea:

1. Multinomial Logistic Regression: Let's say our target variable has K = 4 classes. This technique handles the multi-class problem by fitting K-1 independent binary logistic classifier model. For doing this, it randomly chooses one target class as the reference class and fits K-1 regression models that compare each of the remaining classes to the reference class.

Due to its restrictive nature, it isn't used widely because it does not scale very well in the presence of a large number of target classes. In addition, since it builds K - 1 models, we would require a much larger data set to achieve reasonable accuracy.

2. Ordinal Logistic Regression: This technique is used when the target variable is ordinal in nature. Let's say, we want to predict years of work experience (1,2,3,4,5, etc). So, there exists an order in the value, i.e., 5>4>3>2>1. Unlike a multinomial model, when we train K -1 models, Ordinal Logistic Regression builds a single model with multiple threshold values.

If we have K classes, the model will require K -1 threshold or cutoff points. Also, it makes an imperative assumption of proportional odds. The assumption says that on a logit (S shape) scale, all of the thresholds lie on a straight line.

Note: Logistic Regression is not a great choice to solve multi-class problems. But, it's good to be aware of its types. In this tutorial we'll focus on Logistic Regression for binary classification task.

How does Logistic Regression work?

Now comes the interesting part!

As we know, Logistic Regression assumes that the dependent (or response) variable follows a binomial distribution. Now, you may wonder, what is binomial distribution? Binomial distribution can be identified by the following characteristics:

  1. There must be a fixed number of trials denoted by n, i.e. in the data set, there must be a fixed number of rows.
  2. Each trial can have only two outcomes; i.e., the response variable can have only two unique categories.
  3. The outcome of each trial must be independent of each other; i.e., the unique levels of the response variable must be independent of each other.
  4. The probability of success (p) and failure (q) should be the same for each trial.
Let's understand how Logistic Regression works. For Linear Regression, where the output is a linear combination of input feature(s), we write the equation as:

Y = ?o + ?1X + ?

In Logistic Regression, we use the same equation but with some modifications made to Y. Let's reiterate a fact about Logistic Regression: we calculate probabilities. And, probabilities always lie between 0 and 1. In other words, we can say:

  1. The response value must be positive.
  2. It should be lower than 1.

First, we'll meet the above two criteria. We know the exponential of any value is always a positive number. And, any number divided by number + 1 will always be lower than 1. Let's implement these two findings:

This is the logistic function.

Now we are convinced that the probability value will always lie between 0 and 1. To determine the link function, follow the algebraic calculations carefully. P(Y=1|X) can be read as "probability that Y =1 given some value for x." Y can take only two values, 1 or 0. For ease of calculation, let's rewrite P(Y=1|X) as p(X).

logistic regression equation derivation

As you might recognize, the right side of the (immediate) equation above depicts the linear combination of independent variables. The left side is known as the log - odds or odds ratio or logit function and is the link function for Logistic Regression. This link function follows a sigmoid (shown below) function which limits its range of probabilities between 0 and 1.

SigmoidPlot logistic function

Until here, I hope you've understood how we derive the equation of Logistic Regression. But how is it interpreted?

We can interpret the above equation as, a unit increase in variable x results in multiplying the odds ratio by ? to power ?. In other words, the regression coefficients explain the change in log(odds) in the response for a unit change in predictor. However, since the relationship between p(X) and X is not straight line, a unit change in input feature doesn't really affect the model output directly but it affects the odds ratio.

This is contradictory to Linear Regression where, regardless of the value of input feature, the regression coefficient always represents a fixed increase/decrease in the model output per unit increase in the input feature.

In Multiple Regression, we use the Ordinary Least Square (OLS) method to determine the best coefficients to attain good model fit. In Logistic Regression, we use maximum likelihood method to determine the best coefficients and eventually a good model fit.

Maximum likelihood works like this: It tries to find the value of coefficients (?o,?1) such that the predicted probabilities are as close to the observed probabilities as possible. In other words, for a binary classification (1/0), maximum likelihood will try to find values of ?o and ?1 such that the resultant probabilities are closest to either 1 or 0. The likelihood function is written as

How can you evaluate Logistic Regression model fit and accuracy ?

In Linear Regression, we check adjusted R², F Statistics, MAE, and RMSE to evaluate model fit and accuracy. But, Logistic Regression employs all different sets of metrics. Here, we deal with probabilities and categorical values. Following are the evaluation metrics used for Logistic Regression:

1. Akaike Information Criteria (AIC)

You can look at AIC as counterpart of adjusted r square in multiple regression. It's an important indicator of model fit. It follows the rule: Smaller the better. AIC penalizes increasing number of coefficients in the model. In other words, adding more variables to the model wouldn't let AIC increase. It helps to avoid overfitting.

Looking at the AIC metric of one model wouldn't really help. It is more useful in comparing models (model selection). So, build 2 or 3 Logistic Regression models and compare their AIC. The model with the lowest AIC will be relatively better.

2. Null Deviance and Residual Deviance

Deviance of an observation is computed as -2 times log likelihood of that observation. The importance of deviance can be further understood using its types: Null and Residual Deviance. Null deviance is calculated from the model with no features, i.e.,only intercept. The null model predicts class via a constant probability.

Residual deviance is calculated from the model having all the features.On comarison with Linear Regression, think of residual deviance as residual sum of square (RSS) and null deviance as total sum of squares (TSS). The larger the difference between null and residual deviance, better the model.

Also, you can use these metrics to compared multiple models: whichever model has a lower null deviance, means that the model explains deviance pretty well, and is a better model. Also, lower the residual deviance, better the model. Practically, AIC is always given preference above deviance to evaluate model fit.

3. Confusion Matrix

Confusion matrix is the most crucial metric commonly used to evaluate classification models. It's quite confusing but make sure you understand it by heart. If you still don't understand anything, ask me in comments. The skeleton of a confusion matrix looks like this:

confusion matrix logistic regression

As you can see, the confusion matrix avoids "confusion" by measuring the actual and predicted values in a tabular format. In table above, Positive class = 1 and Negative class = 0. Following are the metrics we can derive from a confusion matrix:

Accuracy - It determines the overall predicted accuracy of the model. It is calculated as Accuracy = (True Positives + True Negatives)/(True Positives + True Negatives + False Positives + False Negatives)

True Positive Rate (TPR) - It indicates how many positive values, out of all the positive values, have been correctly predicted. The formula to calculate the true positive rate is (TP/TP + FN). Also, TPR = 1 - False Negative Rate. It is also known as Sensitivity or Recall.

False Positive Rate (FPR) - It indicates how many negative values, out of all the negative values, have been incorrectly predicted. The formula to calculate the false positive rate is (FP/FP + TN). Also, FPR = 1 - True Negative Rate.

True Negative Rate (TNR) - It indicates how many negative values, out of all the negative values, have been correctly predicted. The formula to calculate the true negative rate is (TN/TN + FP). It is also known as Specificity.

False Negative Rate (FNR) - It indicates how many positive values, out of all the positive values, have been incorrectly predicted. The formula to calculate false negative rate is (FN/FN + TP).

Precision: It indicates how many values, out of all the predicted positive values, are actually positive. It is formulated as:(TP / TP + FP).

F Score: F score is the harmonic mean of precision and recall. It lies between 0 and 1. Higher the value, better the model. It is formulated as 2((precision*recall) / (precision+recall)).

5 Free Python IDE for Machine Learning

Integrated Development Environment (IDE)

An integrated development environment is an application which provides programmers and developers with basic tools to write and test software. In general, an IDE consists of an editor, a compiler (or interpreter), and a debugger which can be accessed through a graphic user interface (GUI).

According to Wikipedia, “Python is a widely used high-level, general-purpose, interpreted, dynamic programming language.” Python is a fairly old and a very popular language. It is open source and is used for web and Internet development (with frameworks such as Django, Flask, etc.), scientific and numeric computing (with the help of libraries such as NumPy, SciPy, etc.), software development, and much more.

Text editors are not enough for building large systems which require integrating modules and libraries and a good IDE is required.

Here is a list of some Python IDEs with their features to help you decide a suitable IDE for your machine learning problem.

JuPyter/IPython Notebook

Project Jupyter started as a derivative of IPython in 2014 to support scientific computing and interactive data science across all programming languages.

IPython Notebook says that “IPython 3.x was the last monolithic release of IPython. As of IPython 4.0, the language-agnostic parts of the project: the notebook format, message protocol, qtconsole, notebook web application, etc. have moved to new projects under the name Jupyter. IPython itself is focused on interactive Python, part of which is providing a Python kernel for Jupyter.”

Jupyter constitutes of three components - notebook web applications, kernels, and notebook documents.

Some of its key features are the following:
  1. It is open source.
  2. It can support up to 40 languages, and it includes languages popular for data science such as Python, R, Scala, Julia, etc.
  3. It allows one to create and share the documents with equations, visualization and most importantly live codes.
  4. There are interactive widgets from which code can produce outputs such as videos, images, and LaTeX. Not only this, interactive widgets can be used to visualize and manipulate data in real-time.
  5. It has got Big Data integration where one can take advantage of Big Data tools, such as Apache Spark, from Scala, Python, and R. One can explore the same data with libraries such as pandas, scikit-learn, ggplot2, dplyr, etc.
  6. The Markdown markup language can provide commentary for the code, that is, one can save logic and thought process inside the notebook and not in the comments section as in Python.
Jupyter- Python IDE

Some of the uses of Jupyter notebook includes data cleaning, data transformation, statistical modelling, and machine learning.

Some of the features specific to machine learning are that it has been integrated with libraries like matplotlib, NumPy, and Pandas. Another major feature of the Jupyter notebook is that it can display plots that are the output of running code cells.

It is currently used by popular companies such as Google, Microsoft, IBM, etc. and educational institutions such as UC Berkeley and Michigan State University.

Free download: Click here.

Machine learning challenge, ML challenge

PyCharm

PyCharm is a Python IDE developed by JetBrains, a software company based in Prague, Czech Republic. Its beta version was released in July 2010 and version 1.0 came three months later in October 2010.

PyCharm is a fully featured, professional Python IDE that comes in two versions: PyCharm Community Edition, which is free, and a much more advanced PyCharm Professional Edition, which comes as a 30-day free trial.

The fact that PyCharm is used by many big companies such as HP, Pinterest, Twitter, Symantec, Groupon, etc. proves its popularity.

Some of its key features are the following:
  1. It includes creative code completion for classes, objects and keywords, auto-indentation and code formatting, and customizable code snippets and formats.
  2. It shows on-the-fly error highlighting (displays error as you type). It also contains PEP-8 for Python that helps in writing neat codes that are easy to support for other languages.
  3. It has features for serving fast and safe refactoring.
  4. It includes a debugger for Python and JavaScript with a graphical UI. One can create and run tests with a GUI-based test runner and coding assistance.
  5. It has a quick documentation/definition view where one can see the documentation or object definition in the place without losing the context. Also, the documentation provided by JetBrains (here) is comprehensive, with video tutorials.
PyCharm- Python IDE

The most important feature that makes it fit for machine learning is its support for libraries such as Scikit-Learn, Matplotlib, NumPy, and Pandas.

There are features like Matplotlib interactive mode which work both in Python and debugger console where one can plot, manage, and explore the graphs in real time.

Also, one can define different environments (Python 2.7; Python 3.5; virtual environments) based on individual projects.

Free download: Click here

Spyder

Spyder stands for Scientific PYthon Development EnviRonment. Spyder’s original author is Pierre Raybaut, and it was officially released on October 18, 2009. Spyder is written in Python.

Some of its key features are the following:
  1. It is open source.
  2. Its editor supports code introspection/analysis features, code completion, horizontal and vertical splitting, and goto definition.
  3. It comes with Python and IPython consoles workspace, and it supports debugging runtime, i.e., as soon as you type it will display the errors.
  4. It has got a documentation viewer where it shows documentation related to classes or functions called either in editor or console.
  5. It also supports variable explorer where one can explore and edit the variables that are created during the execution of file from a graphic user interface like Numpy array ones.
Spyder- Python IDE

It integrates NumPy, Scipy, Matplotlib, and other scientific libraries. Spyder is best when used as an interactive console for building and testing numeric and scientific applications and scripts built on libraries such as NumPy, SciPy, and Matplotlib.

Apart from this, it is a simple and light-weight software which is easy to install and has very detailed documentation.

Rodeo

Rodeo is a Python IDE that's built expressly for doing machine learning and data science in Python. It was developed by Yhat. It uses IPython kernel.

Some of its key features are the following:
  1. It makes it easy to explore, compare, and interact with data frames and plots.
  2. The Rodeo text editor comes with auto-completion, syntax highlighting, and built-in IPython support so that writing code gets faster.
  3. Rodeo comes integrated with Python tutorials. It also includes cheat sheets for quick material reference.
Rodeo- Python IDE

It is useful for the researchers and scientists who are used to working in R and RStudio IDE.

It has many features similar to Spyder, but it lacks many features such as code analysis, PEP 8, etc. Maybe Rodeo will come up with new features in future as it is fairly new.

Free download: Click here.

Geany

Geany is a Python IDE originally written by Enrico Tröger in C and C++. It was initially released on October 19, 2005. It is a small and lightweight IDE (14 MB for windows) which is as capable as any other IDE.

Some of its key features are the following:
  1. Its editor supports syntax highlighting and line numbering.
  2. It also comes with features like auto-completion, auto closing of braces, auto closing of HTML, and XML tags.
  3. It includes code folding and code navigation.
  4. One can build systems to compile and execute the code with the help of external codes.
Geany-Python IDE

Free download: Click here.

For those who are familiar with RStudio and want to look for options in Python, RStudio has included editor support for Python, XML, YAML, SQL, and shell scripts in edition 0.98.932, which was released on June 18 2014, although there is a little support for Python as compared to R.

This is not an exhaustive list. There are other Python IDEs such as PyDev, Eric, Wing, etc. To know about more them, you can go to the Python wiki page here.

Beginners Tutorial on XGBoost and Parameter Tuning in R

Introduction

Last week, we learned about Random Forest Algorithm. Now we know it helps us reduce a model's variance by building models on resampled data and thereby increases its generalization capability. Good!

Now, you might be wondering, what to do next for increasing a model's prediction accuracy ? After all, an ideal model is one which is good at both generalization and prediction accuracy. This brings us to Boosting Algorithms.

Developed in 1989, the family of boosting algorithms has been improved over the years. In this article, we'll learn about XGBoost algorithm.

XGBoost is the most popular machine learning algorithm these days. Regardless of the data type (regression or classification), it is well known to provide better solutions than other ML algorithms. In fact, since its inception (early 2014), it has become the "true love" of kaggle users to deal with structured data. So, if you are planning to compete on Kaggle, xgboost is one algorithm you need to master.

In this article, you'll learn about core concepts of the XGBoost algorithm. In addition, we'll look into its practical side, i.e., improving the xgboost model using parameter tuning in R.

On 5th March 2017: How to win Machine Learning Competitions ?

Table of Contents

  1. What is XGBoost? Why is it so good?
  2. How does XGBoost work?
  3. Understanding XGBoost Tuning Parameters
  4. Practical - Tuning XGBoost using R

Machine learning challenge, ML challenge

What is XGBoost ? Why is it so good ?

XGBoost (Extreme Gradient Boosting) is an optimized distributed gradient boosting library. Yes, it uses gradient boosting (GBM) framework at core. Yet, does better than GBM framework alone. XGBoost was created by Tianqi Chen, PhD Student, University of Washington. It is used for supervised ML problems. Let's look at what makes it so good:

  1. Parallel Computing: It is enabled with parallel processing (using OpenMP); i.e., when you run xgboost, by default, it would use all the cores of your laptop/machine.
  2. Regularization: I believe this is the biggest advantage of xgboost. GBM has no provision for regularization. Regularization is a technique used to avoid overfitting in linear and tree-based models.
  3. Enabled Cross Validation: In R, we usually use external packages such as caret and mlr to obtain CV results. But, xgboost is enabled with internal CV function (we'll see below).
  4. Missing Values: XGBoost is designed to handle missing values internally. The missing values are treated in such a manner that if there exists any trend in missing values, it is captured by the model.
  5. Flexibility: In addition to regression, classification, and ranking problems, it supports user-defined objective functions also. An objective function is used to measure the performance of the model given a certain set of parameters. Furthermore, it supports user defined evaluation metrics as well.
  6. Availability: Currently, it is available for programming languages such as R, Python, Java, Julia, and Scala.
  7. Save and Reload: XGBoost gives us a feature to save our data matrix and model and reload it later. Suppose, we have a large data set, we can simply save the model and use it in future instead of wasting time redoing the computation.
  8. Tree Pruning: Unlike GBM, where tree pruning stops once a negative loss is encountered, XGBoost grows the tree upto max_depth and then prune backward until the improvement in loss function is below a threshold.

I'm sure now you are excited to master this algorithm. But remember, with great power comes great difficulties too. You might learn to use this algorithm in a few minutes, but optimizing it is a challenge. Don't worry, we shall look into it in following sections.

How does XGBoost work ?

XGBoost belongs to a family of boosting algorithms that convert weak learners into strong learners. A weak learner is one which is slightly better than random guessing. Let's understand boosting first (in general).

Boosting is a sequential process; i.e., trees are grown using the information from a previously grown tree one after the other. This process slowly learns from data and tries to improve its prediction in subsequent iterations. Let's look at a classic classification example:

explain boosting

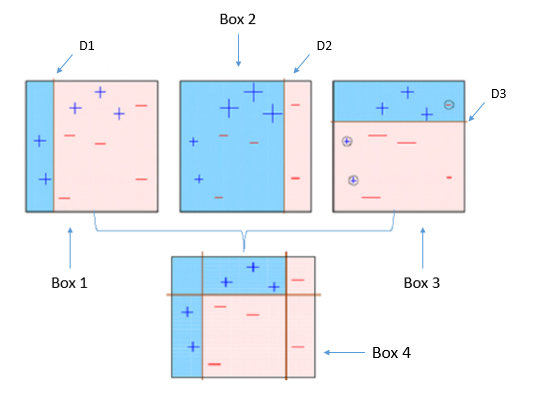
Four classifiers (in 4 boxes), shown above, are trying hard to classify + and - classes as homogeneously as possible. Let's understand this picture well.

  1. Box 1: The first classifier creates a vertical line (split) at D1. It says anything to the left of D1 is + and anything to the right of D1 is -. However, this classifier misclassifies three + points.
  2. Box 2: The next classifier says don't worry I will correct your mistakes. Therefore, it gives more weight to the three + misclassified points (see bigger size of +) and creates a vertical line at D2. Again it says, anything to right of D2 is - and left is +. Still, it makes mistakes by incorrectly classifying three - points.
  3. Box 3: The next classifier continues to bestow support. Again, it gives more weight to the three - misclassified points and creates a horizontal line at D3. Still, this classifier fails to classify the points (in circle) correctly.
  4. Remember that each of these classifiers has a misclassification error associated with them.
  5. Boxes 1,2, and 3 are weak classifiers. These classifiers will now be used to create a strong classifier Box 4.
  6. Box 4: It is a weighted combination of the weak classifiers. As you can see, it does good job at classifying all the points correctly.

That's the basic idea behind boosting algorithms. The very next model capitalizes on the misclassification/error of previous model and tries to reduce it. Now, let's come to XGBoost.

As we know, XGBoost can used to solve both regression and classification problems. It is enabled with separate methods to solve respective problems. Let's see:

Classification Problems: To solve such problems, it uses booster = gbtree parameter; i.e., a tree is grown one after other and attempts to reduce misclassification rate in subsequent iterations. In this, the next tree is built by giving a higher weight to misclassified points by the previous tree (as explained above).

Regression Problems: To solve such problems, we have two methods: booster = gbtree and booster = gblinear. You already know gbtree. In gblinear, it builds generalized linear model and optimizes it using regularization (L1,L2) and gradient descent. In this, the subsequent models are built on residuals (actual - predicted) generated by previous iterations. Are you wondering what is gradient descent? Understanding gradient descent requires math, however, let me try and explain it in simple words:

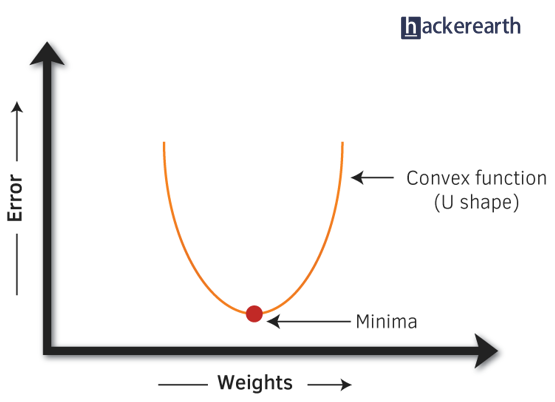
  • Gradient Descent: It is a method which comprises a vector of weights (or coefficients) where we calculate their partial derivative with respective to zero. The motive behind calculating their partial derivative is to find the local minima of the loss function (RSS), which is convex in nature. In simple words, gradient descent tries to optimize the loss function by tuning different values of coefficients to minimize the error.
gradient descent convex function

Hopefully, up till now, you have developed a basic intuition around how boosting and xgboost works. Let's proceed to understand its parameters. After all, using xgboost without parameter tuning is like driving a car without changing its gears; you can never up your speed.

Note: In R, xgboost package uses a matrix of input data instead of a data frame.

Understanding XGBoost Tuning Parameters

Every parameter has a significant role to play in the model's performance. Before hypertuning, let's first understand about these parameters and their importance. In this article, I've only explained the most frequently used and tunable parameters. To look at all the parameters, you can refer to its official documentation.

XGBoost parameters can be divided into three categories (as suggested by its authors):
  • General Parameters: Controls the booster type in the model which eventually drives overall functioning
  • Booster Parameters: Controls the performance of the selected booster
  • Learning Task Parameters: Sets and evaluates the learning process of the booster from the given data

  1. General Parameters
    1. Booster[default=gbtree]
      • Sets the booster type (gbtree, gblinear or dart) to use. For classification problems, you can use gbtree, dart. For regression, you can use any.
    2. nthread[default=maximum cores available]
      • Activates parallel computation. Generally, people don't change it as using maximum cores leads to the fastest computation.
    3. silent[default=0]
      • If you set it to 1, your R console will get flooded with running messages. Better not to change it.

  2. Booster Parameters
  3. As mentioned above, parameters for tree and linear boosters are different. Let's understand each one of them:

    Parameters for Tree Booster

    1. nrounds[default=100]
      • It controls the maximum number of iterations. For classification, it is similar to the number of trees to grow.
      • Should be tuned using CV
    2. eta[default=0.3][range: (0,1)]
      • It controls the learning rate, i.e., the rate at which our model learns patterns in data. After every round, it shrinks the feature weights to reach the best optimum.
      • Lower eta leads to slower computation. It must be supported by increase in nrounds.
      • Typically, it lies between 0.01 - 0.3
    3. gamma[default=0][range: (0,Inf)]
      • It controls regularization (or prevents overfitting). The optimal value of gamma depends on the data set and other parameter values.
      • Higher the value, higher the regularization. Regularization means penalizing large coefficients which don't improve the model's performance. default = 0 means no regularization.
      • Tune trick: Start with 0 and check CV error rate. If you see train error >>> test error, bring gamma into action. Higher the gamma, lower the difference in train and test CV. If you have no clue what value to use, use gamma=5 and see the performance. Remember that gamma brings improvement when you want to use shallow (low max_depth) trees.
    4. max_depth[default=6][range: (0,Inf)]
      • It controls the depth of the tree.
      • Larger the depth, more complex the model; higher chances of overfitting. There is no standard value for max_depth. Larger data sets require deep trees to learn the rules from data.
      • Should be tuned using CV
    5. min_child_weight[default=1][range:(0,Inf)]
      • In regression, it refers to the minimum number of instances required in a child node. In classification, if the leaf node has a minimum sum of instance weight (calculated by second order partial derivative) lower than min_child_weight, the tree splitting stops.
      • In simple words, it blocks the potential feature interactions to prevent overfitting. Should be tuned using CV.
    6. subsample[default=1][range: (0,1)]
      • It controls the number of samples (observations) supplied to a tree.
      • Typically, its values lie between (0.5-0.8)
    7. colsample_bytree[default=1][range: (0,1)]
      • It control the number of features (variables) supplied to a tree
      • Typically, its values lie between (0.5,0.9)
    8. lambda[default=0]
      • It controls L2 regularization (equivalent to Ridge regression) on weights. It is used to avoid overfitting.
    9. alpha[default=1]
      • It controls L1 regularization (equivalent to Lasso regression) on weights. In addition to shrinkage, enabling alpha also results in feature selection. Hence, it's more useful on high dimensional data sets.

    Parameters for Linear Booster

    Using linear booster has relatively lesser parameters to tune, hence it computes much faster than gbtree booster.
    1. nrounds[default=100]
      • It controls the maximum number of iterations (steps) required for gradient descent to converge.
      • Should be tuned using CV
    2. lambda[default=0]
      • It enables Ridge Regression. Same as above
    3. alpha[default=1]
      • It enables Lasso Regression. Same as above

  4. Learning Task Parameters
  5. These parameters specify methods for the loss function and model evaluation. In addition to the parameters listed below, you are free to use a customized objective / evaluation function.

    1. Objective[default=reg:linear]
      • reg:linear - for linear regression
      • binary:logistic - logistic regression for binary classification. It returns class probabilities
      • multi:softmax - multiclassification using softmax objective. It returns predicted class labels. It requires setting num_class parameter denoting number of unique prediction classes.
      • multi:softprob - multiclassification using softmax objective. It returns predicted class probabilities.
    2. eval_metric [no default, depends on objective selected]
      • These metrics are used to evaluate a model's accuracy on validation data. For regression, default metric is RMSE. For classification, default metric is error.
      • Available error functions are as follows:
        • mae - Mean Absolute Error (used in regression)
        • Logloss - Negative loglikelihood (used in classification)
        • AUC - Area under curve (used in classification)
        • RMSE - Root mean square error (used in regression)
        • error - Binary classification error rate [#wrong cases/#all cases]
        • mlogloss - multiclass logloss (used in classification)

We've looked at how xgboost works, the significance of each of its tuning parameter, and how it affects the model's performance. Let's bolster our newly acquired knowledge by solving a practical problem in R.

Practical - Tuning XGBoost in R

In this practical section, we'll learn to tune xgboost in two ways: using the xgboost package and MLR package. I don't see the xgboost R package having any inbuilt feature for doing grid/random search. To overcome this bottleneck, we'll use MLR to perform the extensive parametric search and try to obtain optimal accuracy.

I'll use the adult data set from my previous random forest tutorial. This data set poses a classification problem where our job is to predict if the given user will have a salary <=50K or >50K.

Using random forest, we achieved an accuracy of 85.8%. Theoretically, xgboost should be able to surpass random forest's accuracy. Let's see if we can do it. I'll follow the most common but effective steps in parameter tuning:

  1. First, you build the xgboost model using default parameters. You might be surprised to see that default parameters sometimes give impressive accuracy.
  2. If you get a depressing model accuracy, do this: fix eta = 0.1, leave the rest of the parameters at default value, using xgb.cv function get best n_rounds. Now, build a model with these parameters and check the accuracy.
  3. Otherwise, you can perform a grid search on rest of the parameters (max_depth, gamma, subsample, colsample_bytree etc) by fixing eta and nrounds. Note: If using gbtree, don't introduce gamma until you see a significant difference in your train and test error.
  4. Using the best parameters from grid search, tune the regularization parameters(alpha,lambda) if required.
  5. At last, increase/decrease eta and follow the procedure. But remember, excessively lower eta values would allow the model to learn deep interactions in the data and in this process, it might capture noise. So be careful!

This process might sound a bit complicated, but it's quite easy to code in R. Don't worry, I've demonstrated all the steps below. Let's get into actions now and quickly prepare our data for modeling (if you don't understand any line of code, ask me in comments):

# set working directory
path <- "~/December 2016/XGBoost_Tutorial"
setwd(path)

# load libraries
library(data.table)
library(mlr)

# set variable names
setcol <- c("age",
            "workclass",
            "fnlwgt",
            "education",
            "education-num",
            "marital-status",
            "occupation",
            "relationship",
            "race",
            "sex",
            "capital-gain",
            "capital-loss",
            "hours-per-week",
            "native-country",
            "target")

# load data
train <- read.table("adultdata.txt", header = FALSE, sep = ",",
                    col.names = setcol, na.strings = c(" ?"),
                    stringsAsFactors = FALSE)
test <- read.table("adulttest.txt", header = FALSE, sep = ",",
                   col.names = setcol, skip = 1,
                   na.strings = c(" ?"), stringsAsFactors = FALSE)

# convert data frame to data table
setDT(train)
setDT(test)

# check missing values
table(is.na(train))
sapply(train, function(x) sum(is.na(x)) / length(x)) * 100
table(is.na(test))
sapply(test, function(x) sum(is.na(x)) / length(x)) * 100

# quick data cleaning
# remove extra character from target variable
library(stringr)
test[, target := substr(target, start = 1, stop = nchar(target) - 1)]

# remove leading whitespaces
char_col <- colnames(train)[sapply(test, is.character)]
for (i in char_col) set(train, j = i, value = str_trim(train[[i]], side = "left"))
for (i in char_col) set(test, j = i, value = str_trim(test[[i]], side = "left"))

# set all missing value as "Missing"
train[is.na(train)] <- "Missing"
test[is.na(test)] <- "Missing"

Up to this point, we dealt with basic data cleaning and data inconsistencies. To use xgboost package, keep these things in mind:

  1. Convert the categorical variables into numeric using one hot encoding
  2. For classification, if the dependent variable belongs to class factor, convert it to numeric

R's base function model.matrix is quick enough to implement one hot encoding. In the code below, ~.+0 leads to encoding of all categorical variables without producing an intercept. Alternatively, you can use the dummies package to accomplish the same task. Since xgboost package accepts target variable separately, we'll do the encoding keeping this in mind:

# using one hot encoding
>labels <- train$target
>ts_label <- test$target
>new_tr <- model.matrix(~.+0, data = train[,-c("target"), with = FALSE])
>new_ts <- model.matrix(~.+0, data = test[,-c("target"), with = FALSE])

# convert factor to numeric
>labels <- as.numeric(labels) - 1
>ts_label <- as.numeric(ts_label) - 1

For xgboost, we'll use xgb.DMatrix to convert data table into a matrix (most recommended):

# preparing matrix
>dtrain <- xgb.DMatrix(data = new_tr, label = labels)
&t;dtest <- xgb.DMatrix(data = new_ts, label = ts_label)

As mentioned above, we'll first build our model using default parameters, keeping random forest's accuracy 85.8% in mind. I'll capture the default parameters from above (written against every parameter):

# default parameters
params <- list(
    booster = "gbtree",
    objective = "binary:logistic",
    eta = 0.3,
    gamma = 0,
    max_depth = 6,
    min_child_weight = 1,
    subsample = 1,
    colsample_bytree = 1
)

Using the inbuilt xgb.cv function, let's calculate the best nround for this model. In addition, this function also returns CV error, which is an estimate of test error.

xgbcv <- xgb.cv(
    params = params,
    data = dtrain,
    nrounds = 100,
    nfold = 5,
    showsd = TRUE,
    stratified = TRUE,
    print.every.n = 10,
    early.stop.round = 20,
    maximize = FALSE
)
# best iteration = 79

The model returned lowest error at the 79th (nround) iteration. Also, if you noticed the running messages in your console, you would have understood that train and test error are following each other. We'll use this insight in the following code. Now, we'll see our CV error:

min(xgbcv$test.error.mean)
# 0.1263

As compared to my previous random forest model, this CV accuracy (100-12.63)=87.37% looks better already. However, I believe cross-validation accuracy is usually more optimistic than true test accuracy. Let's calculate our test set accuracy and determine if this default model makes sense:

# first default - model training
xgb1 <- xgb.train(
    params = params,
    data = dtrain,
    nrounds = 79,
    watchlist = list(val = dtest, train = dtrain),
    print.every.n = 10,
    early.stop.round = 10,
    maximize = FALSE,
    eval_metric = "error"
)

# model prediction
xgbpred <- predict(xgb1, dtest)
xgbpred <- ifelse(xgbpred > 0.5, 1, 0)

The objective function binary:logistic returns output predictions rather than labels. To convert it, we need to manually use a cutoff value. As seen above, I've used 0.5 as my cutoff value for predictions. We can calculate our model's accuracy using confusionMatrix() function from caret package.
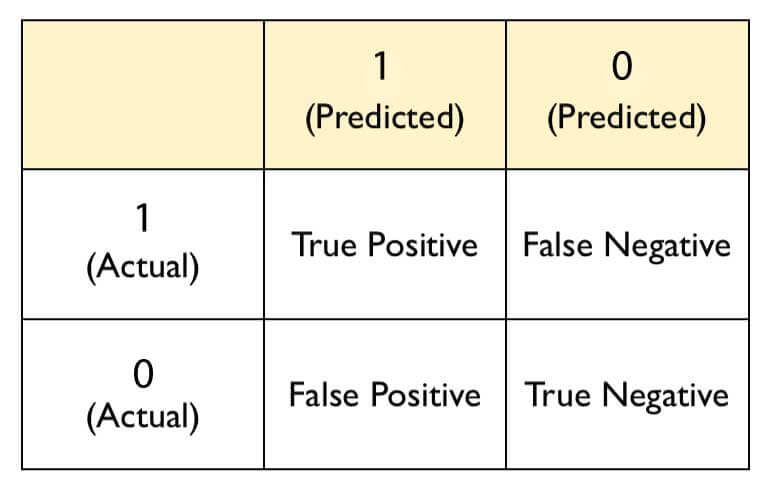
# confusion matrix
library(caret)
confusionMatrix(xgbpred, ts_label)
# Accuracy - 86.54%

# view variable importance plot
mat <- xgb.importance(feature_names = colnames(new_tr), model = xgb1)
xgb.plot.importance(importance_matrix = mat[1:20])  # first 20 variables

xgboost variable importance plot

As you can see, we've achieved better accuracy than a random forest model using default parameters in xgboost. Can we still improve it? Let's proceed to the random / grid search procedure and attempt to find better accuracy. From here on, we'll be using the MLR package for model building. A quick reminder, the MLR package creates its own frame of data, learner as shown below. Also, keep in mind that task functions in mlr doesn't accept character variables. Hence, we need to convert them to factors before creating task:

# convert characters to factors
fact_col <- colnames(train)[sapply(train, is.character)]
for (i in fact_col) set(train, j = i, value = factor(train[[i]]))
for (i in fact_col) set(test, j = i, value = factor(test[[i]]))

# create tasks
traintask <- makeClassifTask(data = train, target = "target")
testtask <- makeClassifTask(data = test, target = "target")

# do one hot encoding
traintask <- createDummyFeatures(obj = traintask, target = "target")
testtask <- createDummyFeatures(obj = testtask, target = "target")

Now, we'll set the learner and fix the number of rounds and eta as discussed above.


#create learner
# create learner
lrn <- makeLearner("classif.xgboost", predict.type = "response")
lrn$par.vals <- list(
    objective = "binary:logistic",
    eval_metric = "error",
    nrounds = 100L,
    eta = 0.1
)

# set parameter space
params <- makeParamSet(
    makeDiscreteParam("booster", values = c("gbtree", "gblinear")),
    makeIntegerParam("max_depth", lower = 3L, upper = 10L),
    makeNumericParam("min_child_weight", lower = 1L, upper = 10L),
    makeNumericParam("subsample", lower = 0.5, upper = 1),
    makeNumericParam("colsample_bytree", lower = 0.5, upper = 1)
)

# set resampling strategy
rdesc <- makeResampleDesc("CV", stratify = TRUE, iters = 5L)

With stratify=T, we'll ensure that distribution of target class is maintained in the resampled data sets. If you've noticed above, in the parameter set, I didn't consider gamma for tuning. Simply because during cross validation, we saw that train and test error are in sync with each other. Had either one of them been dragging or rushing, we could have brought this parameter into action.

Now, we'll set the search optimization strategy. Though, xgboost is fast, instead of grid search, we'll use random search to find the best parameters.

How Fukushima nuclear disaster powered smart farming in Japan

On March 11, 2011, the most intense earthquake in Japanese history hit its north east coast — magnitude 9.0. The earthquake was so powerful that it severely damaged buildings, road, and rail infrastructure in Tokyo, which was 373 km away from the epicenter. This was an undersea megathrust earthquake.

Fifty minutes after the earthquake, tsunami waves as high as 13 meters hit the eastern part of Japan, leaving more than 15,500 dead, 6,000 injured, and 2,500 people missing. The tsunami struck so hard that it resulted in a Level-7 nuclear disaster in Fukushima (in Japanese, Fukushima means Fortune Island); it is the second nuclear disaster in the history of mankind which was given level-7 criticality after the Chernobyl disaster in 1986.

Fukushima had six separate boiling water reactors maintained by Tokyo Electric Power Company (TEPCO). Due to the powerful earthquake and tsunami, the nuclear power plant in Fukushima was subjected to serious structural damage. This resulted in hydrogen-air explosion on top of each nuclear reactor, releasing huge amounts of radioactive particles including Iodine-131, Caesium-134/137, Tellurium-129m, and Strontium 90 into the atmosphere. These radioactive particles contaminated air, soil, and water in and around Fukushima.

Unfortunately, Fukushima was one of the most agriculturally important regions in Japan. There are close to two million farmers in Japan, of which 70,000 are in Fukushima. The farmers of Fukushima had to deal with radioactive contamination of their soil, crops, livestock, and the marine ecosystem in addition to the tragedy caused by the tsunami. Due to radioactive contamination everywhere, the government of Japan imposed restrictions on the growing and selling of crops, dairy products, and seafood.

Now, Japan needed to increase its production to make up for the agricultural loss in Fukushima and, very importantly, it needed food products without radioactive contaminants. If this is not achieved, Japan would head toward a food crisis.

In Kameoka (a satellite town to the west of the Japanese city of Kyoto), the Japanese agriculture technology company SPREAD had started working on a smart farming system on barren land. SPREAD built a vegetable factory in a 2868.22 m2-area.

Inside the doors of this warehouse-like agriculture complex, SPREAD uses vertical farming system.

SPREAD vegetable factory grew lettuce in a soil-less and sunless ecosystem.

SPREAD vertical farming system.
Inside SPREAD vegetable factory

In an interview with CNN on September 19, 2016, Shinji Inada, the president of SPREAD, said, "The turning point was the incident in 2011 at the Fukushima nuclear facility. After what happened there, people became more aware of the importance of safe food and it kind of turned the tables for us."

Here a sophisticated form of hydroculture known as the Hydroponics method is used, where plants are grown in an aqueous solution of mineral nutrients with water as a solvent. In this method, terrestrial plants are grown with roots exposed to a mineral nutrient solution.

Hydroponics method of farming

Since this is an indoor farm, LED lights on top of each shelf provide adequate light for photosynthesis and the growth of lettuce.

indoor farm with LED lights on top
Indoor vertical farm with LED lights on top

At this vegetable factory, human involvement is restricted to sowing the seeds; later, everything till the harvest is taken care of by robots and sensors.

With the help of modern sensor technology, the following factors are measured:

  • Lighting
  • Level of nutrients in the mineral solvent
  • Humidity level inside the setup
  • Temperature level inside the setup
  • Level of CO2

To maintain these factors at the optimal level, robots are installed which take corrective measures.

The lettuce is grown in a highly controlled environment at this facility. As a result of not using any fertilizer, the lettuce grown at this agriculture facility is richer in beta-carotene (an antioxidant) than farm-grown lettuce.

The setup has stacker cranes which carry the stacks to the robots for harvesting after they have reached maturity. It takes 40 days for a lettuce head to be ready for harvest, whereas it takes two months for farm-grown lettuce. After the harvest, the lettuces are moved to the packaging section without any outside intervention. There are either retail or packaging boxes wholesale used for that purpose. The SPREAD’s facility at Kameoka has an output capacity of 21,000 lettuces per day.

This innovative move by SPREAD is not only providing vegetables free from radioactive contamination but also contributing to the ecology to a great extent. Here is how:

Water Recycling

Water used for cultivation of lettuce in the vegetable factory is reused after filtration and purification. At this facility, 98% of water is recycled, and it significantly reduces the water consumption—a mere 0.83 liters is used to grow one head of lettuce.

Water recycling in SPREAD vegetable factory
Water recycling system at SPREAD vegetable factory

Zero damage due to pesticides

Since this vegetable factory uses the hydroponics method to cultivate lettuce, pesticides are not required during the cultivation lifecycle. Hence, soil and water contamination is prevented and the balance of microbes and insects in ecosystem is preserved.

Reduction in energy consumption

SPREAD has developed specialized LED lights and an air conditioning system to be used at their vegetable factory, reducing the energy consumption by 30%.

SPREAD is currently working on a second vegetable factory at Keihanna, with an output capacity of 30,000 heads of lettuce per day with 86.7% reduction in water usage.

In the Spotlight

Technical Screening Guide: All You Need To Know

Read this guide and learn how you can establish a less frustrating developer hiring workflow for both hiring teams and candidates.
Read More
Top Products

Explore HackerEarth’s top products for Hiring & Innovation

Discover powerful tools designed to streamline hiring, assess talent efficiently, and run seamless hackathons. Explore HackerEarth’s top products that help businesses innovate and grow.
Frame
Hackathons
Engage global developers through innovation
Arrow
Frame 2
Assessments
AI-driven advanced coding assessments
Arrow
Frame 3
FaceCode
Real-time code editor for effective coding interviews
Arrow
Frame 4
L & D
Tailored learning paths for continuous assessments
Arrow
Authors

Meet our Authors

Get to know the experts behind our content. From industry leaders to tech enthusiasts, our authors share valuable insights, trends, and expertise to keep you informed and inspired.
Ruehie Jaiya Karri
Kumari Trishya

7 Tech Recruiting Trends To Watch Out For In 2024

The last couple of years transformed how the world works and the tech industry is no exception. Remote work, a candidate-driven market, and automation are some of the tech recruiting trends born out of the pandemic.

While accepting the new reality and adapting to it is the first step, keeping up with continuously changing hiring trends in technology is the bigger challenge right now.

What does 2024 hold for recruiters across the globe? What hiring practices would work best in this post-pandemic world? How do you stay on top of the changes in this industry?

The answers to these questions will paint a clearer picture of how to set up for success while recruiting tech talent this year.

7 tech recruiting trends for 2024

6 Tech Recruiting Trends To Watch Out For In 2022

Recruiters, we’ve got you covered. Here are the tech recruiting trends that will change the way you build tech teams in 2024.

Trend #1—Leverage data-driven recruiting

Data-driven recruiting strategies are the answer to effective talent sourcing and a streamlined hiring process.

Talent acquisition leaders need to use real-time analytics like pipeline growth metrics, offer acceptance rates, quality and cost of new hires, and candidate feedback scores to reduce manual work, improve processes, and hire the best talent.

The key to capitalizing on talent market trends in 2024 is data. It enables you to analyze what’s working and what needs refinement, leaving room for experimentation.

Trend #2—Have impactful employer branding

98% of recruiters believe promoting company culture helps sourcing efforts as seen in our 2021 State Of Developer Recruitment report.

Having a strong employer brand that supports a clear Employer Value Proposition (EVP) is crucial to influencing a candidate’s decision to work with your company. Perks like upskilling opportunities, remote work, and flexible hours are top EVPs that attract qualified candidates.

A clear EVP builds a culture of balance, mental health awareness, and flexibility—strengthening your employer brand with candidate-first policies.

Trend #3—Focus on candidate-driven market

The pandemic drastically increased the skills gap, making tech recruitment more challenging. With the severe shortage of tech talent, candidates now hold more power and can afford to be selective.

Competitive pay is no longer enough. Use data to understand what candidates want—work-life balance, remote options, learning opportunities—and adapt accordingly.

Recruiters need to think creatively to attract and retain top talent.


Recommended read: What NOT To Do When Recruiting Fresh Talent


Trend #4—Have a diversity and inclusion oriented company culture

Diversity and inclusion have become central to modern recruitment. While urgent hiring can delay D&I efforts, long-term success depends on inclusive teams. Our survey shows that 25.6% of HR professionals believe a diverse leadership team helps build stronger pipelines and reduces bias.

McKinsey’s Diversity Wins report confirms this: top-quartile gender-diverse companies see 25% higher profitability, and ethnically diverse teams show 36% higher returns.

It's refreshing to see the importance of an inclusive culture increasing across all job-seeking communities, especially in tech. This reiterates that D&I is a must-have, not just a good-to-have.

—Swetha Harikrishnan, Sr. HR Director, HackerEarth

Recommended read: Diversity And Inclusion in 2022 - 5 Essential Rules To Follow


Trend #5—Embed automation and AI into your recruitment systems

With the rise of AI tools like ChatGPT, automation is being adopted across every business function—including recruiting.

Manual communication with large candidate pools is inefficient. In 2024, recruitment automation and AI-powered platforms will automate candidate nurturing and communication, providing a more personalized experience while saving time.

Trend #6—Conduct remote interviews

With 32.5% of companies planning to stay remote, remote interviewing is here to stay.

Remote interviews expand access to global talent, reduce overhead costs, and increase flexibility—making the hiring process more efficient for both recruiters and candidates.

Trend #7—Be proactive in candidate engagement

Delayed responses or lack of updates can frustrate candidates and impact your brand. Proactive communication and engagement with both active and passive candidates are key to successful recruiting.

As recruitment evolves, proactive candidate engagement will become central to attracting and retaining talent. In 2023 and beyond, companies must engage both active and passive candidates through innovative strategies and technologies like chatbots and AI-powered systems. Building pipelines and nurturing relationships will enhance employer branding and ensure long-term hiring success.

—Narayani Gurunathan, CEO, PlaceNet Consultants

Recruiting Tech Talent Just Got Easier With HackerEarth

Recruiting qualified tech talent is tough—but we’re here to help. HackerEarth for Enterprises offers an all-in-one suite that simplifies sourcing, assessing, and interviewing developers.

Our tech recruiting platform enables you to:

  • Tap into a 6 million-strong developer community
  • Host custom hackathons to engage talent and boost your employer brand
  • Create online assessments to evaluate 80+ tech skills
  • Use dev-friendly IDEs and proctoring for reliable evaluations
  • Benchmark candidates against a global community
  • Conduct live coding interviews with FaceCode, our collaborative coding interview tool
  • Guide upskilling journeys via our Learning and Development platform
  • Integrate seamlessly with all leading ATS systems
  • Access 24/7 support with a 95% satisfaction score

Recommended read: The A-Zs Of Tech Recruiting - A Guide


Staying ahead of tech recruiting trends, improving hiring processes, and adapting to change is the way forward in 2024. Take note of the tips in this article and use them to build a future-ready hiring strategy.

Ready to streamline your tech recruiting? Try HackerEarth for Enterprises today.

(Part 2) Essential Questions To Ask When Interviewing Developers In 2021

The first part of this blog stresses the importance of asking the right technical interview questions to assess a candidate’s coding skills. But that alone is not enough. If you want to hire the crème de la crème of the developer talent out there, you have to look for a well-rounded candidate.

Honest communication, empathy, and passion for their work are equally important as a candidate’s technical knowledge. Soft skills are like the cherry on top. They set the best of the candidates apart from the rest.

Re-examine how you are vetting your candidates. Identify the gaps in your interviews. Once you start addressing these gaps, you find developers who have the potential to be great. And those are exactly the kind of people that you want to work with!

Let’s get to it, shall we?

Hire great developers

What constitutes a good interview question?

An ideal interview should reveal a candidate’s personality along with their technical knowledge. To formulate a comprehensive list of questions, keep in mind three important characteristics.

  • Questions are open-ended – questions like, “What are some of the programming languages you’re comfortable with,” instead of “Do you know this particular programming language” makes the candidate feel like they’re in control. It is also a chance to let them reply to your question in their own words.
  • They address the behavioral aspects of a candidate – ensure you have a few questions on your list that allow a candidate to describe a situation. A situation where a client was unhappy or a time when the developer learned a new technology. Such questions help you assess if the candidate is a good fit for the team.
  • There is no right or wrong answer – it is important to have a structured interview process in place. But this does not mean you have a list of standard answers in mind that you’re looking for. How candidates approach your questions shows you whether they have the makings of a successful candidate. Focus on that rather than on the actual answer itself.

Designing a conversation around these buckets of interview questions brings you to my next question, “What should you look for in each candidate to spot the best ones?”

Hire GREAT developers by asking the right questions

Before we dive deep into the interview questions, we have to think about a few things that have changed. COVID-19 has rendered working from home the new normal for the foreseeable future. As a recruiter, the onus falls upon you to understand whether the developer is comfortable working remotely and has the relevant resources to achieve maximum productivity.

#1 How do you plan your day?

Remote work gives employees the option to be flexible. You don’t have to clock in 9 hours a day as long as you get everything done on time. A developer who hasn’t always been working remotely, but has a routine in place, understands the pitfalls of working from home. It is easy to get distracted and having a schedule to fall back on ensures good productivity.

#2 Do you have experience using tools for collaboration and remote work?

Working from home reduces human interaction heavily. There is no way to just go up to your teammate’s desk and clarify issues. Virtual communication is key to getting work done. Look for what kind of remote working tools your candidate is familiar with and if they know what collaborative tools to use for different tasks.

Value-based interview questions to ask

We went around and spoke to our engineering team, and the recruiting team to see what questions they abide by; what they think makes any candidate tick.

The result? – a motley group of questions that aim to reveal the candidate’s soft skills, in addition to typical technical interview questions and test tasks.


Recommended read: How Recruiting The Right Tech Talent Can Solve Tech Debt


#3 Please describe three recent projects that you worked on. What were the most interesting and challenging parts?

This is an all-encompassing question in that it lets the candidate explain at length about their work ethic—thought process, handling QA, working with a team, and managing user feedback. This also lets you dig enough to assess whether the candidate is taking credit for someone else's work or not.

#4 You’ve worked long and hard to deliver a complex feature for a client and they say it’s not what they asked for. How would you take it?

A good developer will take it in their stride, work closely with the client to find the point of disconnect, and sort out the issue. There are so many things that could go wrong or not be to the client’s liking, and it falls on the developer to remain calm and create solutions.

#5 What new programming languages or technologies have you learned recently?

While being certified in many programming languages doesn't guarantee a great developer, it still is an important technical interview question to ask. It helps highlight a thirst for knowledge and shows that the developer is eager to learn new things.

#6 What does the perfect release look like? Who is involved and what is your role?

Have the developer take you through each phase of a recent software development lifecycle. Ask them to explain their specific role in each phase in this release. This will give you an excellent perspective into a developer’s mind. Do they talk about the before and after of the release? A skilled developer would. The chances of something going wrong in a release are very high. How would the developer react? Will they be able to handle the pressure?


SUBSCRIBE to the HackerEarth blog and enrich your monthly reading with our free e-newsletter – Fresh, insightful and awesome articles straight into your inbox from around the tech recruiting world!


#7 Tell me about a time when you had to convince your lead to try a different approach?

As an example of a behavioral interview question, this is a good one. The way a developer approaches this question speaks volumes about how confident they are expressing their views, and how succinct they are in articulating those views.

#8 What have you done with all the extra hours during the pandemic?

Did you binge-watch your way through the pandemic? I’m sure every one of us has done this. Indulge in a lighthearted conversation with your candidate. This lets them talk about something they are comfortable with. Maybe they learned a new skill or took up a hobby. Get to know a candidate’s interests and little pleasures for a more rounded evaluation.

Over to you! Now that you know what aspects of a candidate to focus on, you are well-equipped to bring out the best in each candidate in their interviews. A mix of strong technical skills and interpersonal qualities is how you spot good developers for your team.

If you have more pressing interview questions to add to this list of ours, please write to us at contact@hackerearth.com.

(Part 1) Essential Questions To Ask When Recruiting Developers In 2021

The minute a developer position opens up, recruiters feel a familiar twinge of fear run down their spines. They recall their previous interview experiences, and how there seems to be a blog post a month that goes viral about bad developer interviews.

While hiring managers, especially the picky ones, would attribute this to a shortage of talented developers, what if the time has come to rethink your interview process? What if recruiters and hiring managers put too much stock into bringing out the technical aspects of each candidate and don’t put enough emphasis on their soft skills?

A report by Robert Half shows that 86% of technology leaders say it’s challenging to find IT talent. Interviewing developers should be a rewarding experience, not a challenging one. If you don’t get caught up in asking specific questions and instead design a simple conversation to gauge a candidate’s way of thinking, it throws up a lot of good insight and makes it fun too.

Developer Hiring Statistics

Asking the right technical interview questions when recruiting developers is important but so is clear communication, good work ethic, and alignment with your organization’s goals.

Let us first see what kind of technical interview questions are well-suited to revealing the coding skills and knowledge of any developer, and then tackle the behavioral aspects of the candidate that sets them apart from the rest.

Recruit GREAT developers by asking the right questions

Here are some technical interview questions that you should ask potential software engineers when interviewing.

#1 Write an algorithm for the following

  1. Minimum Stack - Design a stack that provides 4 functions - push(item), pop, peek, and minimum, all in constant order time complexity. Then move on to coding the actual solution.
  2. Kth Largest Element in an array - This is a standard problem with multiple solutions of best time complexity orders where N log(K) is a common one and O(N) + K log(N) is a lesser-known order. Both solutions are acceptable, not directly comparable to each other, and better than N log(N), which is sorting an array and fetching the Kth element.
  3. Top View of a Binary Tree - Given a root node of the binary tree, return the set of all elements that will get wet if it rains on the tree. Nodes having any nodes directly above them will not get wet.
  4. Internal implementation of a hashtable like a map/dictionary - A candidate needs to specify how key-value pairs are stored, hashing is used and collisions are handled. A good developer not only knows how to use this concept but also how it works. If the developer also knows how the data structure scales when the number of records increases in the hashtable, that is a bonus.

Algorithms demonstrate a candidate’s ability to break down a complex problem into steps. Reasoning and pattern recognition capabilities are some more factors to look for when assessing a candidate. A good candidate can code his thought process of the algorithm finalized during the discussion.


Looking for a great place to hire developers in the US? Try Jooble!


#2 Formulate solutions for the below low-level design (LLD) questions

  • What is LLD? In your own words, specify the different aspects covered in LLD.
  • Design a movie ticket booking application like BookMyShow. Ensure that your database schema is tailored for a theatre with multiple screens and takes care of booking, seat availability, seat arrangement, and seat locking. Your solution does not have to extend to the payment option.
  • Design a basic social media application. Design database schema and APIs for a platform like Twitter with features for following a user, tweeting a post, seeing your tweet, and seeing a user's tweet.

Such questions do not have a right or wrong answer. They primarily serve to reveal a developer’s thought process and the way they approach a problem.


Recommended read: Hardest Tech Roles to Fill (+ solutions!)


#3 Some high-level design (HLD) questions

  • What do you understand by HLD? Can you specify the difference between LLD and HLD?
  • Design a social media application. In addition to designing a platform like Twitter with features for following a user, tweeting a post, seeing your tweet, and seeing a user's tweet, design a timeline. After designing a timeline where you can see your followers’ tweets, scale it for a larger audience. If you still have time, try to scale it for a celebrity use case.
  • Design for a train ticket booking application like IRCTC. Incorporate auth, features to choose start and end stations, view available trains and available seats between two stations, save reservation of seats from start to end stations, and lock them till payment confirmation.
  • How will you design a basic relational database? The database should support tables, columns, basic field types like integer and text, foreign keys, and indexes. The way a developer approaches this question is important. A good developer designs a solution around storage and memory management.
Here’s a pro-tip for you. LLD questions can be answered by both beginners and experienced developers. Mostly, senior developers can be expected to answer HLD questions. Choose your interview questions set wisely, and ask questions relevant to your candidate’s experience.

#4 Have you ever worked with SQL? Write queries for a specific use case that requires multiple joins.

Example: Create a table with separate columns for student name, subject, and marks scored. Return student names and ranks of each student. The rank of a student depends on the total of marks in all subjects.

Not all developers would have experience working with SQL but some knowledge about how data is stored/structured is useful. Developers should be familiar with simple concepts like joins, retrieval queries, and the basics of DBMS.

#5 What do you think is wrong with this code?

Instead of asking developer candidates to write code on a piece of paper (which is outdated, anyway), ask them to debug existing code. This is another way to assess their technical skills. Place surreptitious errors in the code and evaluate their attention to detail.

Now that you know exactly what technical skills to look for and when questions to ask when interviewing developers, the time has come to assess the soft skills of these candidates. Part 2 of this blog throws light on the how and why of evaluating candidates based on their communication skills, work ethic, and alignment with the company’s goals.

View all

Best Pre-Employment Assessments: Optimizing Your Hiring Process for 2024

In today's competitive talent market, attracting and retaining top performers is crucial for any organization's success. However, traditional hiring methods like relying solely on resumes and interviews may not always provide a comprehensive picture of a candidate's skills and potential. This is where pre-employment assessments come into play.

What is Pre-Employement Assessment?

Pre-employment assessments are standardized tests and evaluations administered to candidates before they are hired. These assessments can help you objectively measure a candidate's knowledge, skills, abilities, and personality traits, allowing you to make data-driven hiring decisions.

By exploring and evaluating the best pre-employment assessment tools and tests available, you can:

  • Improve the accuracy and efficiency of your hiring process.
  • Identify top talent with the right skills and cultural fit.
  • Reduce the risk of bad hires.
  • Enhance the candidate experience by providing a clear and objective evaluation process.

This guide will provide you with valuable insights into the different types of pre-employment assessments available and highlight some of the best tools, to help you optimize your hiring process for 2024.

Why pre-employment assessments are key in hiring

While resumes and interviews offer valuable insights, they can be subjective and susceptible to bias. Pre-employment assessments provide a standardized and objective way to evaluate candidates, offering several key benefits:

  • Improved decision-making:

    By measuring specific skills and knowledge, assessments help you identify candidates who possess the qualifications necessary for the job.

  • Reduced bias:

    Standardized assessments mitigate the risks of unconscious bias that can creep into traditional interview processes.

  • Increased efficiency:

    Assessments can streamline the initial screening process, allowing you to focus on the most promising candidates.

  • Enhanced candidate experience:

    When used effectively, assessments can provide candidates with a clear understanding of the required skills and a fair chance to showcase their abilities.

Types of pre-employment assessments

There are various types of pre-employment assessments available, each catering to different needs and objectives. Here's an overview of some common types:

1. Skill Assessments:

  • Technical Skills: These assessments evaluate specific technical skills and knowledge relevant to the job role, such as programming languages, software proficiency, or industry-specific expertise. HackerEarth offers a wide range of validated technical skill assessments covering various programming languages, frameworks, and technologies.
  • Soft Skills: These employment assessments measure non-technical skills like communication, problem-solving, teamwork, and critical thinking, crucial for success in any role.

2. Personality Assessments:

These employment assessments can provide insights into a candidate's personality traits, work style, and cultural fit within your organization.

3. Cognitive Ability Tests:

These tests measure a candidate's general mental abilities, such as reasoning, problem-solving, and learning potential.

4. Integrity Assessments:

These employment assessments aim to identify potential risks associated with a candidate's honesty, work ethic, and compliance with company policies.

By understanding the different types of assessments and their applications, you can choose the ones that best align with your specific hiring needs and ensure you hire the most qualified and suitable candidates for your organization.

Leading employment assessment tools and tests in 2024

Choosing the right pre-employment assessment tool depends on your specific needs and budget. Here's a curated list of some of the top pre-employment assessment tools and tests available in 2024, with brief overviews:

  • HackerEarth:

    A comprehensive platform offering a wide range of validated skill assessments in various programming languages, frameworks, and technologies. It also allows for the creation of custom assessments and integrates seamlessly with various recruitment platforms.

  • SHL:

    Provides a broad selection of assessments, including skill tests, personality assessments, and cognitive ability tests. They offer customizable solutions and cater to various industries.

  • Pymetrics:

    Utilizes gamified assessments to evaluate cognitive skills, personality traits, and cultural fit. They offer a data-driven approach and emphasize candidate experience.

  • Wonderlic:

    Offers a variety of assessments, including the Wonderlic Personnel Test, which measures general cognitive ability. They also provide aptitude and personality assessments.

  • Harver:

    An assessment platform focusing on candidate experience with video interviews, gamified assessments, and skills tests. They offer pre-built assessments and customization options.

Remember: This list is not exhaustive, and further research is crucial to identify the tool that aligns best with your specific needs and budget. Consider factors like the types of assessments offered, pricing models, integrations with your existing HR systems, and user experience when making your decision.

Choosing the right pre-employment assessment tool

Instead of full individual tool reviews, consider focusing on 2–3 key platforms. For each platform, explore:

  • Target audience: Who are their assessments best suited for (e.g., technical roles, specific industries)?
  • Types of assessments offered: Briefly list the available assessment categories (e.g., technical skills, soft skills, personality).
  • Key features: Highlight unique functionalities like gamification, custom assessment creation, or seamless integrations.
  • Effectiveness: Briefly mention the platform's approach to assessment validation and reliability.
  • User experience: Consider including user reviews or ratings where available.

Comparative analysis of assessment options

Instead of a comprehensive comparison, consider focusing on specific use cases:

  • Technical skills assessment:

    Compare HackerEarth and Wonderlic based on their technical skill assessment options, focusing on the variety of languages/technologies covered and assessment formats.

  • Soft skills and personality assessment:

    Compare SHL and Pymetrics based on their approaches to evaluating soft skills and personality traits, highlighting any unique features like gamification or data-driven insights.

  • Candidate experience:

    Compare Harver and Wonderlic based on their focus on candidate experience, mentioning features like video interviews or gamified assessments.

Additional tips:

  • Encourage readers to visit the platforms' official websites for detailed features and pricing information.
  • Include links to reputable third-party review sites where users share their experiences with various tools.

Best practices for using pre-employment assessment tools

Integrating pre-employment assessments effectively requires careful planning and execution. Here are some best practices to follow:

  • Define your assessment goals:

    Clearly identify what you aim to achieve with assessments. Are you targeting specific skills, personality traits, or cultural fit?

  • Choose the right assessments:

    Select tools that align with your defined goals and the specific requirements of the open position.

  • Set clear expectations:

    Communicate the purpose and format of the assessments to candidates in advance, ensuring transparency and building trust.

  • Integrate seamlessly:

    Ensure your chosen assessment tool integrates smoothly with your existing HR systems and recruitment workflow.

  • Train your team:

    Equip your hiring managers and HR team with the knowledge and skills to interpret assessment results effectively.

Interpreting assessment results accurately

Assessment results offer valuable data points, but interpreting them accurately is crucial for making informed hiring decisions. Here are some key considerations:

  • Use results as one data point:

    Consider assessment results alongside other information, such as resumes, interviews, and references, for a holistic view of the candidate.

  • Understand score limitations:

    Don't solely rely on raw scores. Understand the assessment's validity and reliability and the potential for cultural bias or individual test anxiety.

  • Look for patterns and trends:

    Analyze results across different assessments and identify consistent patterns that align with your desired candidate profile.

  • Focus on potential, not guarantees:

    Assessments indicate potential, not guarantees of success. Use them alongside other evaluation methods to make well-rounded hiring decisions.

Choosing the right pre-employment assessment tools

Selecting the most suitable pre-employment assessment tool requires careful consideration of your organization's specific needs. Here are some key factors to guide your decision:

  • Industry and role requirements:

    Different industries and roles demand varying skill sets and qualities. Choose assessments that target the specific skills and knowledge relevant to your open positions.

  • Company culture and values:

    Align your assessments with your company culture and values. For example, if collaboration is crucial, look for assessments that evaluate teamwork and communication skills.

  • Candidate experience:

    Prioritize tools that provide a positive and smooth experience for candidates. This can enhance your employer brand and attract top talent.

Budget and accessibility considerations

Budget and accessibility are essential factors when choosing pre-employment assessments:

  • Budget:

    Assessment tools come with varying pricing models (subscriptions, pay-per-use, etc.). Choose a tool that aligns with your budget and offers the functionalities you need.

  • Accessibility:

    Ensure the chosen assessment is accessible to all candidates, considering factors like language options, disability accommodations, and internet access requirements.

Additional Tips:

  • Free trials and demos: Utilize free trials or demos offered by assessment platforms to experience their functionalities firsthand.
  • Consult with HR professionals: Seek guidance from HR professionals or recruitment specialists with expertise in pre-employment assessments.
  • Read user reviews and comparisons: Gain insights from other employers who use various assessment tools.

By carefully considering these factors, you can select the pre-employment assessment tool that best aligns with your organizational needs, budget, and commitment to an inclusive hiring process.

Remember, pre-employment assessments are valuable tools, but they should not be the sole factor in your hiring decisions. Use them alongside other evaluation methods and prioritize building a fair and inclusive hiring process that attracts and retains top talent.

Future trends in pre-employment assessments

The pre-employment assessment landscape is constantly evolving, with innovative technologies and practices emerging. Here are some potential future trends to watch:

  • Artificial intelligence (AI):

    AI-powered assessments can analyze candidate responses, written work, and even resumes, using natural language processing to extract relevant insights and identify potential candidates.

  • Adaptive testing:

    These assessments adjust the difficulty level of questions based on the candidate's performance, providing a more efficient and personalized evaluation.

  • Micro-assessments:

    Short, focused assessments delivered through mobile devices can assess specific skills or knowledge on-the-go, streamlining the screening process.

  • Gamification:

    Engaging and interactive game-based elements can make the assessment experience more engaging and assess skills in a realistic and dynamic way.

Conclusion

Pre-employment assessments, when used thoughtfully and ethically, can be a powerful tool to optimize your hiring process, identify top talent, and build a successful workforce for your organization. By understanding the different types of assessments available, exploring top-rated tools like HackerEarth, and staying informed about emerging trends, you can make informed decisions that enhance your ability to attract, evaluate, and hire the best candidates for the future.

Tech Layoffs: What To Expect In 2024

Layoffs in the IT industry are becoming more widespread as companies fight to remain competitive in a fast-changing market; many turn to layoffs as a cost-cutting measure. Last year, 1,000 companies including big tech giants and startups, laid off over two lakhs of employees. But first, what are layoffs in the tech business, and how do they impact the industry?

Tech layoffs are the termination of employment for some employees by a technology company. It might happen for various reasons, including financial challenges, market conditions, firm reorganization, or the after-effects of a pandemic. While layoffs are not unique to the IT industry, they are becoming more common as companies look for methods to cut costs while remaining competitive.

The consequences of layoffs in technology may be catastrophic for employees who lose their jobs and the firms forced to make these difficult decisions. Layoffs can result in the loss of skill and expertise and a drop in employee morale and productivity. However, they may be required for businesses to stay afloat in a fast-changing market.

This article will examine the reasons for layoffs in the technology industry, their influence on the industry, and what may be done to reduce their negative impacts. We will also look at the various methods for tracking tech layoffs.

What are tech layoffs?

The term "tech layoff" describes the termination of employees by an organization in the technology industry. A company might do this as part of a restructuring during hard economic times.

In recent times, the tech industry has witnessed a wave of significant layoffs, affecting some of the world’s leading technology companies, including Amazon, Microsoft, Meta (formerly Facebook), Apple, Cisco, SAP, and Sony. These layoffs are a reflection of the broader economic challenges and market adjustments facing the sector, including factors like slowing revenue growth, global economic uncertainties, and the need to streamline operations for efficiency.

Each of these tech giants has announced job cuts for various reasons, though common themes include restructuring efforts to stay competitive and agile, responding to over-hiring during the pandemic when demand for tech services surged, and preparing for a potentially tough economic climate ahead. Despite their dominant positions in the market, these companies are not immune to the economic cycles and technological shifts that influence operational and strategic decisions, including workforce adjustments.

This trend of layoffs in the tech industry underscores the volatile nature of the tech sector, which is often at the mercy of rapid changes in technology, consumer preferences, and the global economy. It also highlights the importance of adaptability and resilience for companies and employees alike in navigating the uncertainties of the tech landscape.

Causes for layoffs in the tech industry

Why are tech employees suffering so much?

Yes, the market is always uncertain, but why resort to tech layoffs?

Various factors cause tech layoffs, including company strategy changes, market shifts, or financial difficulties. Companies may lay off employees if they need help to generate revenue, shift their focus to new products or services, or automate certain jobs.

In addition, some common reasons could be:

Financial struggles

Currently, the state of the global market is uncertain due to economic recession, ongoing war, and other related phenomena. If a company is experiencing financial difficulties, only sticking to pay cuts may not be helpful—it may need to reduce its workforce to cut costs.


Also, read: 6 Steps To Create A Detailed Recruiting Budget (Template Included)


Changes in demand

The tech industry is constantly evolving, and companies would have to adjust their workforce to meet changing market conditions. For instance, companies are adopting remote work culture, which surely affects on-premises activity, and companies could do away with some number of tech employees at the backend.

Restructuring

Companies may also lay off employees as part of a greater restructuring effort, such as spinning off a division or consolidating operations.

Automation

With the advancement in technology and automation, some jobs previously done by human labor may be replaced by machines, resulting in layoffs.

Mergers and acquisitions

When two companies merge, there is often overlap in their operations, leading to layoffs as the new company looks to streamline its workforce.

But it's worth noting that layoffs are not exclusive to the tech industry and can happen in any industry due to uncertainty in the market.

Will layoffs increase in 2024?

It is challenging to estimate the rise or fall of layoffs. The overall state of the economy, the health of certain industries, and the performance of individual companies will play a role in deciding the degree of layoffs in any given year.

But it is also seen that, in the first 15 days of this year, 91 organizations laid off over 24,000 tech workers, and over 1,000 corporations cut down more than 150,000 workers in 2022, according to an Economic Times article.

The COVID-19 pandemic caused a huge economic slowdown and forced several businesses to downsize their employees. However, some businesses rehired or expanded their personnel when the world began to recover.

So, given the current level of economic uncertainty, predicting how the situation will unfold is difficult.


Also, read: 4 Images That Show What Developers Think Of Layoffs In Tech


What types of companies are prone to tech layoffs?

2023 Round Up Of Layoffs In Big Tech

Tech layoffs can occur in organizations of all sizes and various areas.

Following are some examples of companies that have experienced tech layoffs in the past:

Large tech firms

Companies such as IBM, Microsoft, Twitter, Better.com, Alibaba, and HP have all experienced layoffs in recent years as part of restructuring initiatives or cost-cutting measures.

Market scenarios are still being determined after Elon Musk's decision to lay off employees. Along with tech giants, some smaller companies and startups have also been affected by layoffs.

Startups

Because they frequently work with limited resources, startups may be forced to lay off staff if they cannot get further funding or need to pivot due to market downfall.

Small and medium-sized businesses

Small and medium-sized businesses face layoffs due to high competition or if the products/services they offer are no longer in demand.

Companies in certain industries

Some sectors of the technological industry, such as the semiconductor industry or automotive industry, may be more prone to layoffs than others.

Companies that lean on government funding

Companies that rely significantly on government contracts may face layoffs if the government cuts technology spending or contracts are not renewed.

How to track tech layoffs?

You can’t stop tech company layoffs, but you should be keeping track of them. We, HR professionals and recruiters, can also lend a helping hand in these tough times by circulating “layoff lists” across social media sites like LinkedIn and Twitter to help people land jobs quicker. Firefish Software put together a master list of sources to find fresh talent during the layoff period.

Because not all layoffs are publicly disclosed, tracking tech industry layoffs can be challenging, and some may go undetected. There are several ways to keep track of tech industry layoffs:

Use tech layoffs tracker

Layoff trackers like thelayoff.com and layoffs.fyi provide up-to-date information on layoffs.

In addition, they aid in identifying trends in layoffs within the tech industry. It can reveal which industries are seeing the most layoffs and which companies are the most affected.

Companies can use layoff trackers as an early warning system and compare their performance to that of other companies in their field.

News articles

Because many news sites cover tech layoffs as they happen, keeping a watch on technology sector stories can provide insight into which organizations are laying off employees and how many individuals have been affected.

Social media

Organizations and employees frequently publish information about layoffs in tech on social media platforms; thus, monitoring companies' social media accounts or following key hashtags can provide real-time updates regarding layoffs.

Online forums and communities

There are online forums and communities dedicated to discussing tech industry news, and they can be an excellent source of layoff information.

Government reports

Government agencies such as the Bureau of Labor Statistics (BLS) publish data on layoffs and unemployment, which can provide a more comprehensive picture of the technology industry's status.

How do companies reduce tech layoffs?

Layoffs in tech are hard – for the employee who is losing their job, the recruiter or HR professional who is tasked with informing them, and the company itself. So, how can we aim to avoid layoffs? Here are some ways to minimize resorting to letting people go:

Salary reductions

Instead of laying off employees, businesses can lower the salaries or wages of all employees. It can be accomplished by instituting compensation cuts or salary freezes.

Implementing a hiring freeze

Businesses can halt employing new personnel to cut costs. It can be a short-term solution until the company's financial situation improves.


Also, read: What Recruiters Can Focus On During A Tech Hiring Freeze


Non-essential expense reduction

Businesses might search for ways to cut or remove non-essential expenses such as travel, training, and office expenses.

Reducing working hours

Companies can reduce employee working hours to save money, such as implementing a four-day workweek or a shorter workday.

These options may not always be viable and may have their problems, but before laying off, a company owes it to its people to consider every other alternative, and formulate the best solution.

Tech layoffs to bleed into this year

While we do not know whether this trend will continue or subside during 2023, we do know one thing. We have to be prepared for a wave of layoffs that is still yet to hit. As of last month, Layoffs.fyi had already tracked 170+ companies conducting 55,970 layoffs in 2023.

So recruiters, let’s join arms, distribute those layoff lists like there’s no tomorrow, and help all those in need of a job! :)

What is Headhunting In Recruitment?: Types &amp; How Does It Work?

In today’s fast-paced world, recruiting talent has become increasingly complicated. Technological advancements, high workforce expectations and a highly competitive market have pushed recruitment agencies to adopt innovative strategies for recruiting various types of talent. This article aims to explore one such recruitment strategy – headhunting.

What is Headhunting in recruitment?

In headhunting, companies or recruitment agencies identify, engage and hire highly skilled professionals to fill top positions in the respective companies. It is different from the traditional process in which candidates looking for job opportunities approach companies or recruitment agencies. In headhunting, executive headhunters, as recruiters are referred to, approach prospective candidates with the hiring company’s requirements and wait for them to respond. Executive headhunters generally look for passive candidates, those who work at crucial positions and are not on the lookout for new work opportunities. Besides, executive headhunters focus on filling critical, senior-level positions indispensable to companies. Depending on the nature of the operation, headhunting has three types. They are described later in this article. Before we move on to understand the types of headhunting, here is how the traditional recruitment process and headhunting are different.

How do headhunting and traditional recruitment differ from each other?

Headhunting is a type of recruitment process in which top-level managers and executives in similar positions are hired. Since these professionals are not on the lookout for jobs, headhunters have to thoroughly understand the hiring companies’ requirements and study the work profiles of potential candidates before creating a list.

In the traditional approach, there is a long list of candidates applying for jobs online and offline. Candidates approach recruiters for jobs. Apart from this primary difference, there are other factors that define the difference between these two schools of recruitment.

AspectHeadhuntingTraditional RecruitmentCandidate TypePrimarily passive candidateActive job seekersApproachFocused on specific high-level rolesBroader; includes various levelsScopeproactive outreachReactive: candidates applyCostGenerally more expensive due to expertise requiredTypically lower costsControlManaged by headhuntersManaged internally by HR teams

All the above parameters will help you to understand how headhunting differs from traditional recruitment methods, better.

Types of headhunting in recruitment

Direct headhunting: In direct recruitment, hiring teams reach out to potential candidates through personal communication. Companies conduct direct headhunting in-house, without outsourcing the process to hiring recruitment agencies. Very few businesses conduct this type of recruitment for top jobs as it involves extensive screening across networks outside the company’s expanse.

Indirect headhunting: This method involves recruiters getting in touch with their prospective candidates through indirect modes of communication such as email and phone calls. Indirect headhunting is less intrusive and allows candidates to respond at their convenience.Third-party recruitment: Companies approach external recruitment agencies or executive headhunters to recruit highly skilled professionals for top positions. This method often leverages the company’s extensive contact network and expertise in niche industries.

How does headhunting work?

Finding highly skilled professionals to fill critical positions can be tricky if there is no system for it. Expert executive headhunters employ recruitment software to conduct headhunting efficiently as it facilitates a seamless recruitment process for executive headhunters. Most software is AI-powered and expedites processes like candidate sourcing, interactions with prospective professionals and upkeep of communication history. This makes the process of executive search in recruitment a little bit easier. Apart from using software to recruit executives, here are the various stages of finding high-calibre executives through headhunting.

Identifying the role

Once there is a vacancy for a top job, one of the top executives like a CEO, director or the head of the company, reach out to the concerned personnel with their requirements. Depending on how large a company is, they may choose to headhunt with the help of an external recruiting agency or conduct it in-house. Generally, the task is assigned to external recruitment agencies specializing in headhunting. Executive headhunters possess a database of highly qualified professionals who work in crucial positions in some of the best companies. This makes them the top choice of conglomerates looking to hire some of the best talents in the industry.

Defining the job

Once an executive headhunter or a recruiting agency is finalized, companies conduct meetings to discuss the nature of the role, how the company works, the management hierarchy among other important aspects of the job. Headhunters are expected to understand these points thoroughly and establish a clear understanding of their expectations and goals.

Candidate identification and sourcing

Headhunters analyse and understand the requirements of their clients and begin creating a pool of suitable candidates from their database. The professionals are shortlisted after conducting extensive research of job profiles, number of years of industry experience, professional networks and online platforms.

Approaching candidates

Once the potential candidates have been identified and shortlisted, headhunters move on to get in touch with them discreetly through various communication channels. As such candidates are already working at top level positions at other companies, executive headhunters have to be low-key while doing so.

Assessment and Evaluation

In this next step, extensive screening and evaluation of candidates is conducted to determine their suitability for the advertised position.

Interviews and negotiations

Compensation is a major topic of discussion among recruiters and prospective candidates. A lot of deliberation and negotiation goes on between the hiring organization and the selected executives which is facilitated by the headhunters.

Finalizing the hire

Things come to a close once the suitable candidates accept the job offer. On accepting the offer letter, headhunters help finalize the hiring process to ensure a smooth transition.

The steps listed above form the blueprint for a typical headhunting process. Headhunting has been crucial in helping companies hire the right people for crucial positions that come with great responsibility. However, all systems have a set of challenges no matter how perfect their working algorithm is. Here are a few challenges that talent acquisition agencies face while headhunting.

Common challenges in headhunting

Despite its advantages, headhunting also presents certain challenges:

Cost Implications: Engaging headhunters can be more expensive than traditional recruitment methods due to their specialized skills and services.

Time-Consuming Process: While headhunting can be efficient, finding the right candidate for senior positions may still take time due to thorough evaluation processes.

Market Competition: The competition for top talent is fierce; organizations must present compelling offers to attract passive candidates away from their current roles.

Although the above mentioned factors can pose challenges in the headhunting process, there are more upsides than there are downsides to it. Here is how headhunting has helped revolutionize the recruitment of high-profile candidates.

Advantages of Headhunting

Headhunting offers several advantages over traditional recruitment methods:

Access to Passive Candidates: By targeting individuals who are not actively seeking new employment, organisations can access a broader pool of highly skilled professionals.

Confidentiality: The discreet nature of headhunting protects both candidates’ current employment situations and the hiring organisation’s strategic interests.

Customized Search: Headhunters tailor their search based on the specific needs of the organization, ensuring a better fit between candidates and company culture.

Industry Expertise: Many headhunters specialise in particular sectors, providing valuable insights into market dynamics and candidate qualifications.

Conclusion

Although headhunting can be costly and time-consuming, it is one of the most effective ways of finding good candidates for top jobs. Executive headhunters face several challenges maintaining the g discreetness while getting in touch with prospective clients. As organizations navigate increasingly competitive markets, understanding the nuances of headhunting becomes vital for effective recruitment strategies. To keep up with the technological advancements, it is better to optimise your hiring process by employing online recruitment software like HackerEarth, which enables companies to conduct multiple interviews and evaluation tests online, thus improving candidate experience. By collaborating with skilled headhunters who possess industry expertise and insights into market trends, companies can enhance their chances of securing high-caliber professionals who drive success in their respective fields.

View all