Developer Insights

Thank you! Your submission has been received!
Oops! Something went wrong while submitting the form.

14 Incredible women who've reshaped the Data Science / Analytics Industry

Times are changing and have been for a while now. In the world of STEM, women are no longer considered a “bad fit,” which is easily proved by the amazing number of brilliant women in the field today. Women are just as interested in finding out how things work, extracting insight from data, problem-solving, and helping businesses make the right decisions. Staggering amounts of data and knowing that it will only grow has paved the way for boundless opportunities for jobs related to data science, across both genders.

Disappointing Statistics in Favor

Despite being named the sexiest job of the century, data science seems to have few takers among the women folk. Following are some interesting stats about women in the technology domain:

  • The American Association of University Women found that the percentage of women in math and computational jobs fell from 35% in 1990 to 26% in 2013.
  • BetterBuys’ collated report shows that women make up about 26% of data professionals, with 39% researcher roles, 28% in creative roles, 18% in business management roles, and 13% in developer roles.
  • In 2014, women held only 13% of the Chief Information Officer and 25% of Chief Data Officer positions. What is worse is that research found “women were two times more likely than men to quit high-tech positions.”

So, what’s stopping more women from getting into data science and analytics?

We don’t want people talking about gender gap in the world of technology and analytics anymore. Seriously, there is no conspiracy to keep women out of this typically male-dominated sphere. We need diversity in the boardroom, like now.

Machine learning challenge, ML challenge

Why are women not "gung-ho" about such an exciting field?

Women often face challenges in the form of stereotypes and condescension, especially in developing countries like India, when trying to prove their worth. Cultural perception affects their self-confidence and chances of growth. You find women struggling to find work-life balance. Battling these undercurrents and the lack of adequate support and encouragement at home and workplace are sources of stress many talented women are choosing to do without.

Not an ideal situation…

But take heart, aspiring women data scientists. This is what Evenbrite’s Senior Data Scientist, Vesela Gateva, says:

Once you have a very genuine curiosity in a quantitative field or anything science-related, let your curiosity be your main guidance. You shouldn’t think that you’re a woman. I never aspired to be a data scientist. It’s a very recent term. I just ended up being one. All I knew was that I wanted to apply my quantitative skills, solving interesting problems. Women in general tend to give themselves less credit than they deserve. What women should know is that once they have the curiosity, and the basic fundamentals of probability and statistics, computer science, and machine learning, they can figure out the rest on their own.

Gender shouldn’t limit accomplishments, and it certainly shouldn’t define a person’s identity.

14 Women who've hit the stereotype out of the park

What aspiring women data scientists need are to look to bright women who have defied odds to rise to leadership positions in the field of analytics. No point in whining about lack of female representation if you are going to contribute, is there?

Let's appreciate these women for their work and incessant dedication which has helped millions of people around the world to inspire, learn and rise in their respective careers.

Corinna Cortes, Google Research

She needs no introduction to people who in the world of Machine Learning. Corinna Cortes is the head of Google Research (NY), prior to which she was a distinguished researcher for a decade at AT&T Bell Labs. Her development of the algorithm, Support Vector Machines, fetched her the Paris Kanellakis Theory and Practice Award in 2008. She received her PhD in Computer Science in 1993 from the University of Rochester (NY) and has an MS in Physics from the University of Copenhagen. This amazing mother of two is a competitive runner as well. Read her latest tweets here.

Daphne Koller, Co-founder, Coursera

Israeli-American Daphne Koller is a leading expert in the field of machine learning, with special focus on probabilistic graphical models. She is the Chief Computing Officer at Calico Labs. Daphne is also the co-founder of the popular online education platform Coursera. She was a Stanford University professor of Computer Science for nearly two decades. Daphne Koller earned her PhD from Stanford, BS and MS from Hebrew University of Jerusalem, and has done her Post-doctoral research at UCLA. To view her many achievements, go here. When she’s not immersed in her work, you can find her spending time with her daughter or unwinding to music.

Adele Cutler, Random Forest Algorithm Co-Developer

Random Forests (a trademarked statistical classifier) co-developer Adele Cutler has a PhD from University of California, Berkeley, and a math degree from the University of Auckland. She’s been a statistics professor at Utah State University for almost three decades and continues her research in data mining and decision trees. She says, “As statisticians, what we’re really trying to do is think of better ways to get information out of data.” Adele Cutler has varied interests apart from math and stats, including spending time with her family in Taupo and Edinburgh, taking holidays, beading, and knitting. You can find more about her here.

Jenn Wortman Vaughan, Microsoft Research

Jennifer Vaughan is a Senior Researcher at NYC-based Microsoft Research. She is interested in learning models and algorithms related to data aggregation. She received her PhD in 2009 in Computer and Information Science from the University of Pennsylvania, a Masters from Stanford in Computer Science, and a Bachelors in Computer Science from Boston University. She previously worked as an Assistant Professor (CS) in UCLA and was a Harvard University Computing Innovation Fellow. She has a handful of prestigious awards to her name, including a National Science Foundation CAREER award and a Presidential Early Career Award for Scientists and Engineers. In 2006, Jenn co-founded the Annual Workshop for Women in Machine Learning. If you want to know about this rising star, go to here website.

Erin LeDell, Machine Learning Scientist, H2O.ai

California-based H2O.ai Machine Learning scientist, Erin LeDell has a doctorate in “Biostatistics and the Designated Emphasis in Computational Science and Engineering” from the University of California, Berkeley. She has a B.S. and M.A. in Mathematics. Her earlier work history includes working as the Principal Data Scientist at Wise.io and Marvin Mobile Security. Erin is also the founder of DataScientific, Inc. She has co-authored Subsemble: An Ensemble Method for Combining Subset-Specific Algorithm Fits. She is a co-founder of R-Ladies Global, an organization to encourage gender diversity in the R stats community. You can find Erin LeDell here.

Jennifer Bryan, Associate Professor Statistics, UBC

Jennifer Bryan is an Associate Professor, Statistics & Michael Smith Labs, at the University of British Columbia. She's a biostatistician specializing in genomics, and she enjoys statistical computing and data analysis. She has a BA in Economics from Yale and a doctoral degree from the University of California, Berkeley. She takes a popular introductory course in R. Look at her Twitter feed here.

Hilary Mason, Founder, Fast Forward Labs

In her own words, “I love data and cheeseburgers!” Based in New York, Hilary Mason is the founder of Fast Forward Labs, a machine intelligence research company, and the Data Scientist in Residence at Accel. Her magic doesn’t end there. She co-hosts DataGotham, is a member of NYCResistor, and co-founded of HackNY. Apart from being featured in top publications like the Scientific American, she has received the TechFellows Engineering Leadership award and was on the Forbes 40 under 40 Ones to Watch list. She has co-authored Data Driven: Creating a Data Culture. For inspiration, you should look at her LinkedIn profile.

Radhika Kulkarni, Vice President, Advanced Analytics R&D, SAS

Based in Durham, NC, Radhika Kulkarni is the Vice President, Advanced Analytics R&D, at SAS Institute Inc. She has a Masters in Mathematics from IIT-Delhi and a PhD in Operations Research from Cornell University. In her 30-year career with SAS, one of the foremost optimization software vendors, she has received many accolades—she is a SAS CEO Award of Excellence winner and chosen as one of the 100 Diverse Corporate Leaders in STEM by STEMconnector. She loves spending time with her three kids, and is very social. In her own words, “I'm well known to be the party animal.” Check out here tweets here.

Alice Zheng, Senior Manager, Amazon

Alice Zheng is a Senior Manager of Applied Science at Amazon. She heads the optimization team on Amazon's Ad Platform. She was a Microsoft researcher for six years before her stint as the Director of Data Science at Dato. Her focus is on building scalable models in Machine Learning. She has undergraduate degrees in Computer Science and Math and a doctoral degree in electrical engineering from the University of California, Berkeley. Alice Zheng has written two books in the field of data science. She says, “My research focuses on easing the dependence on expertise by making learning algorithms more automated, their outputs more interpretable, and the labeling tasks simpler.” Look at her LinkedIn profile to read more interesting things about her.

Charlotte Wickham, Assistant Professor Statistics, OSU

Charlotte Wickham works as an Assistant Professor of Statistics at the Oregon State University. An R specialist, she creates courseware for Data Camp. She has an Undergraduate degree in Statistics from the University of Auckland and a PhD in Statistics from the University of California, Berkeley. You can visit her website for more information.

Monica Rogati, Former Senior Data Scientist, LinkedIn

Former VP of Data at Jawbone and LinkedIn senior data scientist, Monica Rogati is now an independent data science advisor. Her description on Medium is quite apt: Turning data into products and stories. Based in Sunnyvale, California, she has a PhD in Computer Science from the Carnegie Mellon University and a B.S. in computer science from the University of New Mexico. Her expertise lies in applied machine learning, text mining, and recommender systems. From wearable computing to developing a system to match a job to a candidate, she is an ace at it all. Her LinkedIn profile is chock-full of achievements. You can also follow her at @mrogati.

Alice Daish, Data Scientist, British Museum

Alice Daish is a Data Scientist at the British Museum and a co-Founder of R-Ladies Global. She says, “I love data, R, science and innovation.” Her interests include data analysis, data visualization, predictive modelling, data communication, mentoring, and gender diversity in STEM.S he has a BSc. in Conservation Biology & Ecology from the University of Exeter and an MSc. in Quantitative Biology from Imperial College London. For a more detailed record of her projects and publications, go here. Follow Alice!

Amy O'Connor, Big Data Evangelist, Cloudera

Amy O'Connor is a Big Data evangelist at Cloudera. Prior to this, she was the Senior Director of the Big Data group at Nokia, and prior to that she was Senior Director of Strategy at Sun Microsystems. She describes herself as “a geek in high heels.” Amy O'Connor was on the Information Management’s “10 Big Data Experts to Know” in 2015. She has a BS in Electrical Engineering from the University of Connecticut and an MBA from Northeastern University. Follow her here.

Julia Evans, Machine Learning Engineer, Stripe

Montreal-based Julia Evans says “I love using serious systems in silly ways.” She has undergraduate and graduate degrees in Mathematics and Computer Science from McGill University. She works as a Machine Learning engineer at Stripe. She is passionate about programming and puts events together for women with similar interests. You can read for yourself here. Follow her interesting tweets here.

Women have great communication skills—a necessary skill when you need to tell decision makers what the results of the data analysis are. They are collaborative by nature—a key skill when people from different fields work together. They can think differently and tackle assumptions—vital skills when coupled with business acumen, stats, math, computer science, modeling, and analytical expertise. Admittedly men and women think differently. But that is what analysis is about, isn’t it? Different perspectives?

Like machine learning expert Claudia Perlich, Chief Scientist at Dstillery, said,

“Ultimately, data science is another technical field where women remain statistically a minority, but I do not believe that we need to force the issue or “fight” for a higher female quota. I want to come to work and do what I love and be recognized for what I bring to the table and not waste even one thought on the fact that I am female.”

So there really is no excuse for women to not enter this fascinating world of Data Science is there? Women just need to recognize that they have so much to bring to the table.

Practical Tutorial on Random Forest and Parameter Tuning in R

Introduction

Treat "forests" well. Not for the sake of nature, but for solving problems too!

Random Forest is one of the most versatile machine learning algorithms available today. With its built-in ensembling capacity, the task of building a decent generalized model (on any dataset) gets much easier. However, I've seen people using random forest as a black box model; i.e., they don't understand what's happening beneath the code. They just code.

In fact, the easiest part of machine learning is coding. If you are new to machine learning, the random forest algorithm should be on your tips. Its ability to solve—both regression and classification problems along with robustness to correlated features and variable importance plot gives us enough head start to solve various problems.

Most often, I've seen people getting confused in bagging and random forest. Do you know the difference?

In this article, I'll explain the complete concept of random forest and bagging. For ease of understanding, I've kept the explanation simple yet enriching. I've used MLR, data.table packages to implement bagging, and random forest with parameter tuning in R. Also, you'll learn the techniques I've used to improve model accuracy from ~82% to 86%.

Table of Contents

  1. What is the Random Forest algorithm?
  2. How does it work? (Decision Tree, Random Forest)
  3. What is the difference between Bagging and Random Forest?
  4. Advantages and Disadvantages of Random Forest
  5. Solving a Problem
    • Parameter Tuning in Random Forest

What is the Random Forest algorithm?

Random forest is a tree-based algorithm which involves building several trees (decision trees), then combining their output to improve generalization ability of the model. The method of combining trees is known as an ensemble method. Ensembling is nothing but a combination of weak learners (individual trees) to produce a strong learner.

Say, you want to watch a movie. But you are uncertain of its reviews. You ask 10 people who have watched the movie. 8 of them said "the movie is fantastic." Since the majority is in favor, you decide to watch the movie. This is how we use ensemble techniques in our daily life too.

Random Forest can be used to solve regression and classification problems. In regression problems, the dependent variable is continuous. In classification problems, the dependent variable is categorical.

Trivia: The random Forest algorithm was created by Leo Breiman and Adele Cutler in 2001.

How does it work? (Decision Tree, Random Forest)

To understand the working of a random forest, it's crucial that you understand a tree. A tree works in the following way:

decision tree explaining

1. Given a data frame (n x p), a tree stratifies or partitions the data based on rules (if-else). Yes, a tree creates rules. These rules divide the data set into distinct and non-overlapping regions. These rules are determined by a variable's contribution to the homogeneity or pureness of the resultant child nodes (X2, X3).

2. In the image above, the variable X1 resulted in highest homogeneity in child nodes, hence it became the root node. A variable at root node is also seen as the most important variable in the data set.

3. But how is this homogeneity or pureness determined? In other words, how does the tree decide at which variable to split?

  • In regression trees (where the output is predicted using the mean of observations in the terminal nodes), the splitting decision is based on minimizing RSS. The variable which leads to the greatest possible reduction in RSS is chosen as the root node. The tree splitting takes a top-down greedy approach, also known as recursive binary splitting. We call it "greedy" because the algorithm cares to make the best split at the current step rather than saving a split for better results on future nodes.
  • In classification trees (where the output is predicted using mode of observations in the terminal nodes), the splitting decision is based on the following methods:
    • Gini Index - It's a measure of node purity. If the Gini index takes on a smaller value, it suggests that the node is pure. For a split to take place, the Gini index for a child node should be less than that for the parent node.
    • Entropy - Entropy is a measure of node impurity. For a binary class (a, b), the formula to calculate it is shown below. Entropy is maximum at p = 0.5. For p(X=a)=0.5 or p(X=b)=0.5 means a new observation has a 50%-50% chance of getting classified in either class. The entropy is minimum when the probability is 0 or 1.

Entropy = - p(a)*log(p(a)) - p(b)*log(p(b))

entropy curve

In a nutshell, every tree attempts to create rules in such a way that the resultant terminal nodes could be as pure as possible. Higher the purity, lesser the uncertainty to make the decision.

But a decision tree suffers from high variance. "High Variance" means getting high prediction error on unseen data. We can overcome the variance problem by using more data for training. But since the data set available is limited to us, we can use resampling techniques like bagging and random forest to generate more data.

Building many decision trees results in a forest. A random forest works the following way:

  1. First, it uses the Bagging (Bootstrap Aggregating) algorithm to create random samples. Given a data set D1 (n rows and p columns), it creates a new dataset (D2) by sampling n cases at random with replacement from the original data. About 1/3 of the rows from D1 are left out, known as Out of Bag (OOB) samples.
  2. Then, the model trains on D2. OOB sample is used to determine unbiased estimate of the error.
  3. Out of p columns, P ≪ p columns are selected at each node in the data set. The P columns are selected at random. Usually, the default choice of P is p/3 for regression tree and √p for classification tree.
  4. pruning decision trees 
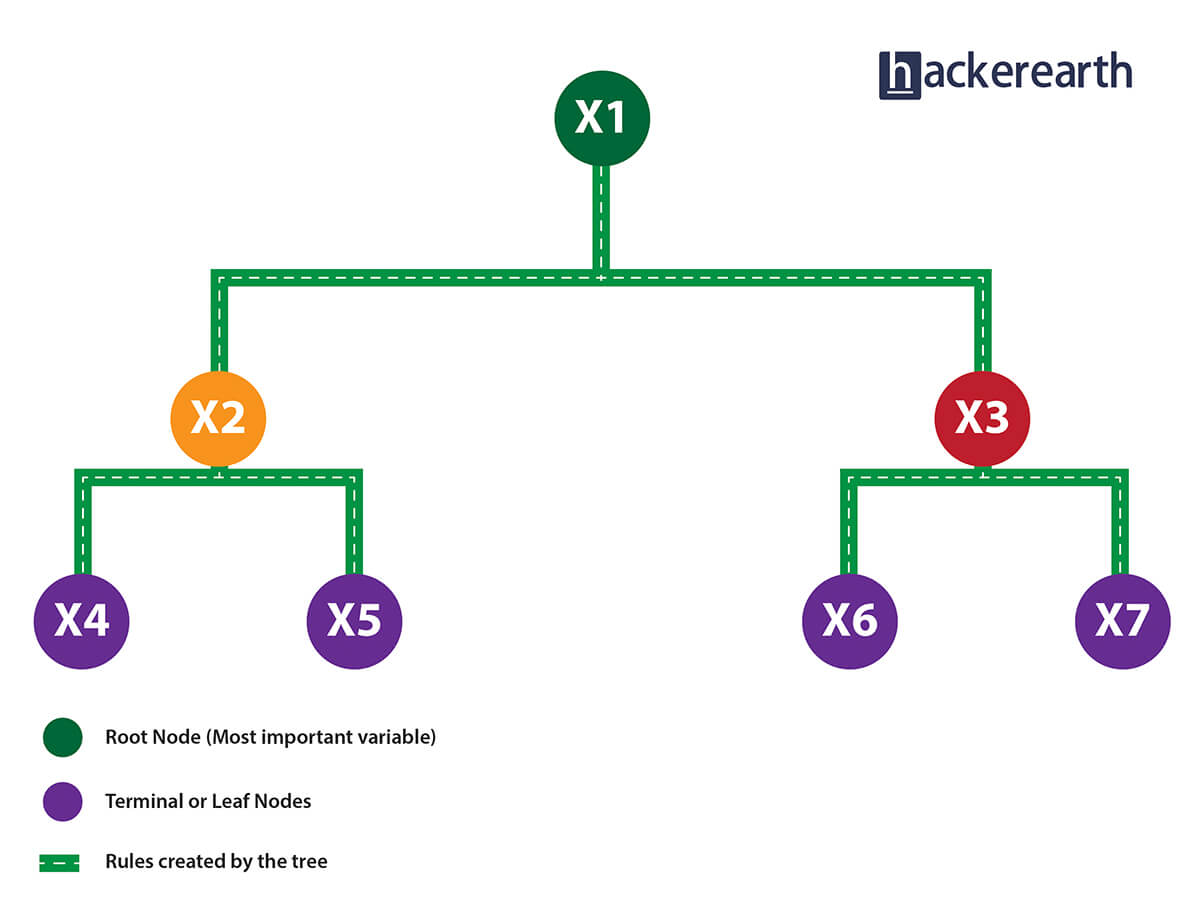
Unlike a tree, no pruning takes place in random forest; i.e., each tree is grown fully. In decision trees, pruning is a method to avoid overfitting. Pruning means selecting a subtree that leads to the lowest test error rate. We can use cross-validation to determine the test error rate of a subtree.
  5. Several trees are grown and the final prediction is obtained by averaging (for regression) or majority voting (for classification).

Each tree is grown on a different sample of original data. Since random forest has the feature to calculate OOB error internally, cross-validation doesn't make much sense in random forest.

What is the difference between Bagging and Random Forest?

Many a time, we fail to ascertain that bagging is not the same as random forest. To understand the difference, let's see how bagging works:

  1. It creates randomized samples of the dataset (just like random forest) and grows trees on a different sample of the original data. The remaining 1/3 of the sample is used to estimate unbiased OOB error.
  2. It considers all the features at a node (for splitting).
  3. Once the trees are fully grown, it uses averaging or voting to combine the resultant predictions.

Aren't you thinking, "If both the algorithms do the same thing, what is the need for random forest? Couldn't we have accomplished our task with bagging?" NO!

The need for random forest surfaced after discovering that the bagging algorithm results in correlated trees when faced with a dataset having strong predictors. Unfortunately, averaging several highly correlated trees doesn't lead to a large reduction in variance.

But how do correlated trees emerge? Good question! Let's say a dataset has a very strong predictor, along with other moderately strong predictors. In bagging, a tree grown every time would consider the very strong predictor at its root node, thereby resulting in trees similar to each other.

The main difference between random forest and bagging is that random forest considers only a subset of predictors at a split. This results in trees with different predictors at the top split, thereby resulting in decorrelated trees and more reliable average output. That's why we say random forest is robust to correlated predictors.

Advantages and Disadvantages of Random Forest

Advantages are as follows:

  1. It is robust to correlated predictors.
  2. It is used to solve both regression and classification problems.
  3. It can also be used to solve unsupervised ML problems.
  4. It can handle thousands of input variables without variable selection.
  5. It can be used as a feature selection tool using its variable importance plot.
  6. It takes care of missing data internally in an effective manner.

Disadvantages are as follows:

  1. The Random Forest model is difficult to interpret.
  2. It tends to return erratic predictions for observations out of the range of training data. For example, if the training data contains a variable x ranging from 30 to 70, and the test data has x = 200, random forest would give an unreliable prediction.
  3. It can take longer than expected to compute a large number of trees.

Solving a Problem (Parameter Tuning)

Let's take a dataset to compare the performance of bagging and random forest algorithms. Along the way, I'll also explain important parameters used for parameter tuning. In R, we'll use MLR and data.table packages to do this analysis.

I've taken the Adult dataset from the UCI machine learning repository. You can download the data from here.

This dataset presents a binary classification problem to solve. Given a set of features, we need to predict if a person's salary is <=50K or >=50K. Since the given data isn't well structured, we'll need to make some modification while reading the dataset.

# set working directory
path <- "~/December 2016/RF_Tutorial"
setwd(path)
# Set working directory
path <- "~/December 2016/RF_Tutorial"
setwd(path)

# Load libraries
library(data.table)
library(mlr)
library(h2o)

# Set variable names
setcol <- c("age",
            "workclass",
            "fnlwgt",
            "education",
            "education-num",
            "marital-status",
            "occupation",
            "relationship",
            "race",
            "sex",
            "capital-gain",
            "capital-loss",
            "hours-per-week",
            "native-country",
            "target")

# Load data
train <- read.table("adultdata.txt", header = FALSE, sep = ",", 
                    col.names = setcol, na.strings = c(" ?"), stringsAsFactors = FALSE)
test <- read.table("adulttest.txt", header = FALSE, sep = ",", 
                   col.names = setcol, skip = 1, na.strings = c(" ?"), stringsAsFactors = FALSE)

After we've loaded the dataset, first we'll set the data class to data.table. data.table is the most powerful R package made for faster data manipulation.


>setDT(train)
>setDT(test)

Now, we'll quickly look at given variables, data dimensions, etc.


>dim(train)
>dim(test)
>str(train)
>str(test)

As seen from the output above, we can derive the following insights:

  1. The train dataset has 32,561 rows and 15 columns.
  2. The test dataset has 16,281 rows and 15 columns.
  3. Variable target is the dependent variable.
  4. The target variable in train and test data is different. We'll need to match them.
  5. All character variables have a leading whitespace which can be removed.

We can check missing values using:

# Check missing values in train and test datasets
>table(is.na(train))
# Output:
#  FALSE   TRUE 
#  484153  4262

>sapply(train, function(x) sum(is.na(x)) / length(x)) * 100

table(is.na(test))
# Output:
#  FALSE  TRUE 
#  242012 2203

>sapply(test, function(x) sum(is.na(x)) / length(x)) * 100

As seen above, both train and test datasets have missing values. The sapply function is quite handy when it comes to performing column computations. Above, it returns the percentage of missing values per column.

Now, we'll preprocess the data to prepare it for training. In R, random forest internally takes care of missing values using mean/mode imputation. Practically speaking, sometimes it takes longer than expected for the model to run.

Therefore, in order to avoid waiting time, let's impute the missing values using median/mode imputation method; i.e., missing values in the integer variables will be imputed with median and in the factor variables with mode (most frequent value).

We'll use the impute function from the mlr package, which is enabled with several unique methods for missing value imputation:

# Impute missing values
>imp1 <- impute(data = train, target = "target", 
              classes = list(integer = imputeMedian(), factor = imputeMode()))

>imp2 <- impute(data = test, target = "target", 
              classes = list(integer = imputeMedian(), factor = imputeMode()))

# Assign the imputed data back to train and test
>train <- imp1$data
>test <- imp2$data

Being a binary classification problem, you are always advised to check if the data is imbalanced or not. We can do it in the following way:

# Check class distribution in train and test datasets
setDT(train)[, .N / nrow(train), target]
# Output:
#    target     V1
# 1: <=50K   0.7591904
# 2: >50K    0.2408096

setDT(test)[, .N / nrow(test), target]
# Output:
#    target     V1
# 1: <=50K.  0.7637737
# 2: >50K.   0.2362263

If you observe carefully, the value of the target variable is different in test and train. For now, we can consider it a typo error and correct all the test values. Also, we see that 75% of people in the train data have income <=50K. Imbalanced classification problems are known to be more skewed with a binary class distribution of 90% to 10%. Now, let's proceed and clean the target column in test data.

# Clean trailing character in test target values
test[, target := substr(target, start = 1, stop = nchar(target) - 1)]

We've used the substr function to return the substring from a specified start and end position. Next, we'll remove the leading whitespaces from all character variables. We'll use the str_trim function from the stringr package.

> library(stringr)
> char_col <- colnames(train)[sapply(train, is.character)]
> for(i in char_col)
>     set(train, j = i, value = str_trim(train[[i]], side = "left"))

Using sapply function, we've extracted the column names which have character class. Then, using a simple for - set loop we traversed all those columns and applied the str_trim function.

Before we start model training, we should convert all character variables to factor. MLR package treats character class as unknown.


> fact_col <- colnames(train)[sapply(train,is.character)]
>for(i in fact_col)
			set(train,j=i,value = factor(train[[i]]))
>for(i in fact_col)
	     set(test,j=i,value = factor(test[[i]]))

Let's start with modeling now. MLR package has its own function to convert data into a task, build learners, and optimize learning algorithms. I suggest you stick to the modeling structure described below for using MLR on any data set.

#create a task
> traintask <- makeClassifTask(data = train,target = "target")
> testtask <- makeClassifTask(data = test,target = "target")

#create learner > bag <- makeLearner("classif.rpart",predict.type = "response") > bag.lrn <- makeBaggingWrapper(learner = bag,bw.iters = 100,bw.replace = TRUE)

I've set up the bagging algorithm which will grow 100 trees on randomized samples of data with replacement. To check the performance, let's set up a validation strategy too:

#set 5 fold cross validation
> rdesc <- makeResampleDesc("CV", iters = 5L)

For faster computation, we'll use parallel computation backend. Make sure your machine / laptop doesn't have many programs running in the background.

#set parallel backend (Windows)
> library(parallelMap)
> library(parallel)
> parallelStartSocket(cpus = detectCores())
>

For linux users, the function parallelStartMulticore(cpus = detectCores()) will activate parallel backend. I've used all the cores here.

r <- resample(learner = bag.lrn,
              task = traintask,
              resampling = rdesc,
              measures = list(tpr, fpr, fnr, fpr, acc),
              show.info = T)

#[Resample] Result: 
# tpr.test.mean = 0.95,
# fnr.test.mean = 0.0505,
# fpr.test.mean = 0.487,
# acc.test.mean = 0.845

Being a binary classification problem, I've used the components of confusion matrix to check the model's accuracy. With 100 trees, bagging has returned an accuracy of 84.5%, which is way better than the baseline accuracy of 75%. Let's now check the performance of random forest.

#make randomForest learner
> rf.lrn <- makeLearner("classif.randomForest")
> rf.lrn$par.vals <- list(ntree = 100L,
                          importance = TRUE)

> r <- resample(learner = rf.lrn,
                task = traintask,
                resampling = rdesc,
                measures = list(tpr, fpr, fnr, fpr, acc),
                show.info = T)

# Result:
# tpr.test.mean = 0.996,
# fpr.test.mean = 0.72,
# fnr.test.mean = 0.0034,
# acc.test.mean = 0.825

On this data set, random forest performs worse than bagging. Both used 100 trees and random forest returns an overall accuracy of 82.5 %. An apparent reason being that this algorithm is messing up classifying the negative class. As you can see, it classified 99.6% of the positive classes correctly, which is way better than the bagging algorithm. But it incorrectly classified 72% of the negative classes.

Internally, random forest uses a cutoff of 0.5; i.e., if a particular unseen observation has a probability higher than 0.5, it will be classified as <=50K. In random forest, we have the option to customize the internal cutoff. As the false positive rate is very high now, we'll increase the cutoff for positive classes (<=50K) and accordingly reduce it for negative classes (>=50K). Then, train the model again.

#set cutoff
> rf.lrn$par.vals <- list(ntree = 100L,
                          importance = TRUE,
                          cutoff = c(0.75, 0.25))

> r <- resample(learner = rf.lrn,
                task = traintask,
                resampling = rdesc,
                measures = list(tpr, fpr, fnr, fpr, acc),
                show.info = T)

#Result: 
# tpr.test.mean = 0.934,
# fpr.test.mean = 0.43,
# fnr.test.mean = 0.0662,
# acc.test.mean = 0.846

As you can see, we've improved the accuracy of the random forest model by 2%, which is slightly higher than that for the bagging model. Now, let's try and make this model better.

Parameter Tuning: Mainly, there are three parameters in the random forest algorithm which you should look at (for tuning):

  • ntree - As the name suggests, the number of trees to grow. Larger the tree, it will be more computationally expensive to build models.
  • mtry - It refers to how many variables we should select at a node split. Also as mentioned above, the default value is p/3 for regression and sqrt(p) for classification. We should always try to avoid using smaller values of mtry to avoid overfitting.
  • nodesize - It refers to how many observations we want in the terminal nodes. This parameter is directly related to tree depth. Higher the number, lower the tree depth. With lower tree depth, the tree might even fail to recognize useful signals from the data.

Let get to the playground and try to improve our model's accuracy further. In MLR package, you can list all tuning parameters a model can support using:

> getParamSet(rf.lrn)

# set parameter space
params <- makeParamSet(
    makeIntegerParam("mtry", lower = 2, upper = 10),
    makeIntegerParam("nodesize", lower = 10, upper = 50)
)

# set validation strategy
rdesc <- makeResampleDesc("CV", iters = 5L)

# set optimization technique
ctrl <- makeTuneControlRandom(maxit = 5L)

# start tuning
> tune <- tuneParams(learner = rf.lrn,
                     task = traintask,
                     resampling = rdesc,
                     measures = list(acc),
                     par.set = params,
                     control = ctrl,
                     show.info = T)

[Tune] Result: mtry=2; nodesize=23 : acc.test.mean=0.858

After tuning, we have achieved an overall accuracy of 85.8%, which is better than our previous random forest model. This way you can tweak your model and improve its accuracy.

I'll leave you here. The complete code for this analysis can be downloaded from Github.

Summary

Don't stop here! There is still a huge scope for improvement in this model. Cross validation accuracy is generally more optimistic than true test accuracy. To make a prediction on the test set, minimal data preprocessing on categorical variables is required. Do it and share your results in the comments below.

My motive to create this tutorial is to get you started using the random forest model and some techniques to improve model accuracy. For better understanding, I suggest you read more on confusion matrix. In this article, I've explained the working of decision trees, random forest, and bagging.

Did I miss out anything? Do share your knowledge and let me know your experience while solving classification problems in comments below.

Exclusive SQL Tutorial on Data Analysis in R

Introduction

Many people are pursuing data science as a career (to become a data scientist) choice these days. With the recent data deluge, companies are voraciously headhunting people who can handle, understand, analyze, and model data.

Be it college graduates or experienced professionals, everyone is busy searching for the best courses or training material to become a data scientist. Some of them even manage to learn Python or R, but still can't land their first analytics job!

What most people fail to understand is that the data science/analytics industry isn't just limited to using Python or R. There are several other coding languages which companies use to run their businesses.

Among all, the most important and widely used language is SQL (Structured Query Language). You must learn it.

I've realized that, as a newbie, learning SQL is somewhat difficult at home. After all, setting up a server enabled database engine isn't everybody's cup of tea. Isn't it? Don't you worry.

In this article, we'll learn all about SQL and how to write its queries.

Note: This article is meant to help R users who wants to learn SQL from scratch. Even if you are new to R, you can still check out this tutorial as the ultimate motive is to learn SQL here.

Table of Contents

  1. Why learn SQL ?
  2. What is SQL?
  3. Getting Started with SQL
    • Data Selection
    • Data Manipulation
    • Strings & Dates
  4. Practising SQL in R
Machine learning challenge, ML challenge

Why learn SQL ?

Good question! When I started learning SQL, I asked this question too. Though, I had no one to answer me. So, I decided to find it out myself.

SQL is the de facto standard programming language used to handle relational databases.

Let's look at the dominance / popularity of SQL in worldwide analytics / data science industry. According to an online survey conducted by Oreilly Media in 2016, it was found that among all the programming languages, SQL was used by 70% of the respondents followed by R and Python. It was also discovered that people who know Excel (Spreadsheet) tend to get significant salary boost once they learn SQL.

Also, according to a survey done by datasciencecentral, it was inferred that R users tend to get a nice salary boost once they learn SQL. In a way, SQL as a language is meant to complement your current set of skills.

Since 1970, SQL has remained an integral part of popular databases such as Oracle, IBM DB2, Microsoft SQL Server, MySQL, etc. Not only learning SQL with R will increase your employability, but SQL itself can make way for you in database management roles.

What is SQL ?

SQL (Structured Query Language) is a special purpose programming language used to manage, extract, and aggregate data stored in large relational database management systems.

In simple words, think of a large machine (rectangular shape) consisting of many, many boxes (again rectangles). Each box comprises a table (dataset). This is a database. A database is an organized collection of data. Now, this database understands only one language, i.e, SQL. No English, Japanese, or Spanish. Just SQL. Therefore, SQL is a language which interacts with the databases to retrieve data.

Following are some important features of SQL:

  1. It allows us to create, update, retrieve, and delete data from the database.
  2. It works with popular database programs such as Oracle, DB2, SQL Server, etc.
  3. As the databases store humongous amounts of data, SQL is widely known for it speed and efficiency.
  4. It is very simple and easy to learn.
  5. It is enabled with inbuilt string and date functions to execute data-time conversions.

Currently, businesses worldwide use both open source and proprietary relational database management systems (RDBMS) built around SQL.

Getting Started with SQL

Let's try to understand SQL commands now. Most of these commands are extremely easy to pick up as they are simple "English words." But make sure you get a proper understanding of their meanings and usage in SQL context. For your ease of understanding, I've categorized the SQL commands in three sections:

  1. Data Selection - These are SQL's indigenous commands used to retrieve tables from databases supported by logical statements.
  2. Data Manipulation - These commands would allow you to join and generate insights from data.
  3. Strings and Dates - These special commands would allow you to work diligently with dates and string variables.

Before we start, you must know that SQL functions recognize majorly four data types. These are:

  1. Integers - This datatype is assigned to variables storing whole numbers, no decimals. For example, 123,324,90,10,1, etc.
  2. Boolean - This datatype is assigned to variables storing TRUE or FALSE data.
  3. Numeric - This datatype is assigned to variables storing decimal numbers. Internally, it is stored as a double precision. It can store up to 15 -17 significant digits.
  4. Date/Time - This datatype is assigned to variables storing data-time information. Internally, it is stored as a time stamp.

That's all! If SQL finds a variable whose type is anything other than these four, it will throw read errors. For example, if a variable has numbers with a comma (like 432,), you'll get errors. SQL as a language is very particular about the sequence of commands given. If the sequence is not followed, it starts to throw errors. Don't worry I've defined the sequence below. Let's learn the commands. In the following section, we'll learn to use them with a data set.

Data Selection

  1. SELECT - It tells you which columns to select.
  2. FROM - It tells you columns to be selected should be from which table (dataset).
  3. LIMIT - By default, a command is executed on all rows in a table. This command limits the number of rows. Limiting the rows leads to faster execution of commands.
  4. WHERE - This command specifies a filter condition; i.e., the data retrieval has to be done based on some variable filtering.
  5. Comparison Operators - Everyone knows these operators as (=, !=, <, >, <=, >=). They are used in conjunction with the WHERE command.
  6. Logical Operators - The famous logical operators (AND, OR, NOT) are also used to specify multiple filtering conditions. Other operators include:
    • LIKE - It is used to extract similar values and not exact values.
    • IN - It is used to specify the list of values to extract or leave out from a variable.
    • BETWEEN - It activates a condition based on variable(s) in the table.
    • IS NULL - It allows you to extract data without missing values from the specified column.
  7. ORDER BY - It is used to order a variable in descending or ascending order.

Data Manipulation

  1. Aggregate Functions - These functions are helpful in generating quick insights from data sets.
    • COUNT - It counts the number of observations.
    • SUM - It calculates the sum of observations.
    • MIN/MAX - It calculates the min/max and the range of a numerical distribution.
    • AVG - It calculates the average (mean).
  2. GROUP BY - For categorical variables, it calculates the above stats based on their unique levels.
  3. HAVING - Mostly used for strings to specify a particular string or combination while retrieving data.
  4. DISTINCT - It returns the unique number of observations.
  5. CASE - It is used to create rules using if/else conditions.
  6. JOINS - Used to merge individual tables. It can implement:
    • INNER JOIN - Returns the common rows from A and B based on joining criteria.
    • OUTER JOIN - Returns the rows not common to A and B.
    • LEFT JOIN - Returns the rows in A but not in B.
    • RIGHT JOIN - Returns the rows in B but not in A.
    • FULL OUTER JOIN - Returns all rows from both tables, often with NULLs.
  7. ON - Used to specify a column for filtering while joining tables.
  8. UNION - Similar to rbind() in R. Combines two tables with identical variable names.

You can write complex join commands using comparison operators, WHERE, or ON to specify conditions.

sql joins data analysis data science

Strings and Dates

  1. NOW - Returns current time.
  2. LEFT - Returns a specified number of characters from the left in a string.
  3. RIGHT - Returns a specified number of characters from the right in a string.
  4. LENGTH - Returns the length of the string.
  5. TRIM - Removes characters from the beginning and end of the string.
  6. SUBSTR - Extracts part of a string with specified start and end positions.
  7. CONCAT - Combines strings.
  8. UPPER - Converts a string to uppercase.
  9. LOWER - Converts a string to lowercase.
  10. EXTRACT - Extracts date components such as day, month, year, etc.
  11. DATE_TRUNC - Rounds dates to the nearest unit of measurement.
  12. COALESCE - Imputes missing values.

These commands are not case sensitive, but consistency is important. SQL commands follow this standard sequence:

  1. SELECT
  2. FROM
  3. WHERE
  4. GROUP BY
  5. HAVING
  6. ORDER BY
  7. LIMIT

Practising SQL in R

For writing SQL queries, we'll use the sqldf package. It activates SQL in R using SQLite (default) and can be faster than base R for some manipulations. It also supports H2 Java database, PostgreSQL, and MySQL.

You can easily connect database servers using this package and query data. For more details, check the GitHub repo by its author.

When using SQL in R, think of R as the database machine. Load datasets using read.csv or read.csv.sql and start querying. Ready? Let’s begin! Code every line as you scroll. Practice builds confidence.

We'll use the babynames dataset. Install and load it with:

> install.packages("babynames")
> library(babynames)
> str(babynames)

This dataset contains 1.8 million observations and 5 variables. The prop variable is the proportion of a name given in a year. Now, load the sqldf package:

> install.packages("sqldf")
> library(sqldf)

Let’s check the number of rows in this data.

> sqldf("select count(*) from mydata")
#1825433

Ignore the warnings here. Next, let's look at the data — the first 10 rows:

> sqldf("select * from mydata limit 10")

* selects all columns. To select specific variables:

> sqldf("select year, sex, name from mydata limit 10")

To rename a column in the output using AS:

> sqldf("select year, sex as 'Gender' from mydata limit 10")

Filtering data with WHERE and logical conditions:

> sqldf("select year, name, sex as 'Gender' from mydata where sex == 'F' limit 20")
> sqldf("select * from mydata where prop > 0.05 limit 20")
> sqldf("select * from mydata where sex != 'F'")
> sqldf("select year, name, 4 * prop as 'final_prop' from mydata where prop <= 0.40 limit 10")

Ordering data:

> sqldf("select * from mydata order by year desc limit 20")
> sqldf("select * from mydata order by year desc, n desc limit 20")
> sqldf("select * from mydata order by name limit 20")

Filtering with string patterns:

> sqldf("select * from mydata where name like 'Ben%'")
> sqldf("select * from mydata where name like '%man' limit 30")
> sqldf("select * from mydata where name like '%man%'")
> sqldf("select * from mydata where name in ('Coleman','Benjamin','Bennie')")
> sqldf("select * from mydata where year between 2000 and 2014")

Multiple filters with logical operators:

> sqldf("select * from mydata where year >= 1980 and prop < 0.5")
> sqldf("select * from mydata where year >= 1980 and prop < 0.5 order by prop desc")
> sqldf("select * from mydata where name != '%man%' or year > 2000")
> sqldf("select * from mydata where prop > 0.07 and year not between 2000 and 2014")
> sqldf("select * from mydata where n > 10000 order by name desc")

Basic aggregation:

> sqldf("select sum(n) as 'Total_Count' from mydata")
> sqldf("select min(n), max(n) from mydata")
> sqldf("select year, avg(n) as 'Average' from mydata group by year order by Average desc")
> sqldf("select year, count(*) as count from mydata group by year limit 100")
> sqldf("select year, n, count(*) as 'my_count' from mydata where n > 10000 group by year order by my_count desc limit 100")

Using HAVING instead of WHERE for aggregations:

> sqldf("select year, name, sum(n) as 'my_sum' from mydata group by year having my_sum > 10000 order by my_sum desc limit 100")

Counting distinct names:

> sqldf("select count(distinct name) as 'count_names' from mydata")

Creating new columns using CASE (if/else logic):

> sqldf("select year, n, case when year = '2014' then 'Young' else 'Old' end as 'young_or_old' from mydata limit 10")
> sqldf("select *, case when name != '%man%' then 'Not_a_man' when name = 'Ban%' then 'Born_with_Ban' else 'Un_Ban_Man' end as 'Name_Fun' from mydata")

Joining data sets using a key:

> crash <- read.csv.sql("crashes.csv", sql = "select * from file")
> roads <- read.csv.sql("roads.csv", sql = "select * from file")
> sqldf("select * from crash join roads on crash.Road = roads.Road")
> sqldf("select crash.Year, crash.Volume, roads.* from crash left join roads on crash.Road = roads.Road")

Joining with aggregation and multiple keys:

> sqldf("select crash.Year, crash.Volume, roads.* from crash left join roads on crash.Road = roads.Road order by 1")
> sqldf("select crash.Year, crash.Volume, roads.* from crash left join roads on crash.Road = roads.Road where roads.Road != 'US-36' order by 1")
> sqldf("select Road, avg(roads.Length) as 'Avg_Length', avg(N_Crashes) as 'Avg_Crash' from roads join crash using (Road) group by Road")
> roads$Year <- crash$Year[1:5]
> sqldf("select crash.Year, crash.Volume, roads.* from crash left join roads on crash.Road = roads.Road and crash.Year = roads.Year order by 1")

String operations in sqldf with RSQLite extension:

> library(RSQLite)
> help("initExtension")

> sqldf("select name, leftstr(name, 3) as 'First_3' from mydata order by First_3 desc limit 100")
> sqldf("select name, reverse(name) as 'Rev_Name' from mydata limit 100")
> sqldf("select name, rightstr(name, 3) as 'Back_3' from mydata order by First_3 desc limit 100")

Summary

The aim of this article was to help you get started writing queries in SQL using a blend of practical and theoretical explanations. Beyond these queries, SQL also allows you to write subqueries aka nested queries to execute multiple commands in one go. We shall learn about those in future tutorials.

As I said above, learning SQL will not only give you a fatter paycheck but also allow you to seek job profiles other than that of a data scientist. As I always say, SQL is easy to learn but difficult to master. Do practice enough.

In this article, we learned the basics of SQL. We learned about data selection, aggregation, and string manipulation commands in SQL. In addition, we also looked at the industry trend of SQL language to infer if that's the programming language you will promise to learn in your new year resolution. So, will you?

If you get stuck with any query written above, do drop in your suggestions, questions, and feedback in comments below!

Winning the HackerEarth Machine Learning challenge

A 2-day experience at Societe Generale, Bengaluru

Societe Generale, one of the largest banks in France, in collaboration with HackerEarth, organized Brainwaves, the annual hackathon at Bengaluru on November 12–13, 2016. The theme of the hackathon this year was “Machine Learning”.

The hackathon had an online qualifier from where 85 top teams out of 2200 registrations from all over India, were selected for the final round. The final round was a 30-hour long hackathon which needed the teams to solve 1 problem out of 3 given problems spanning across transaction fraud detection, image and text analytics.

I decided to solve the former since I have had experience working with banking data in multiple firms I have previously worked with.

Top 3 teams pose for the customary picture

Brief Approach

For the first problem, we were given millions of historical transactions to find patterns from and use these patterns to find anomalies on future transactions. We quickly skimmed through the data and built our machine learning model to predict the fraud on future transactional data and ranked #1 on the leaderboard.

Eventually, we also built dashboards which can be used for proactive real-time monitoring for detection of any kind of new anomalies, or they can also be used to monitor transaction throughput etc.

You could think of it like a one-stop control center with a global view of what’s going through the system. One commonly known fraudulent behaviour is, fraudsters try to exploit the system by doing high number of small debits and one large credit, thus swindling the money across countries and exchanges and hence trying to circumvent the defences of the system.

This particular kind was quite challenging to incorporate into our machine learning model on and we are glad to have solved it to a good extent in 30 hours. Eventually, we had a good dashboard, a very good model and made an excellent pitch to the jury and ranked 1st amongst 85 teams.

Machine learning challenge, ML challenge

Experiences at the hackathon

The hackathon was very well organized in terms of the quality of problem statements in the online and offline rounds, the way the organizing team responded to any queries. It was genuinely surprising to see many mentors walking down to our table, talking to us about our backgrounds and providing us various domain related insights which augmented our model and resulted in higher performance.

Our team with the amazing mentors

Even during the late hours none of them really left the place, they would always come and check if we were stalled anywhere and help us directionally so that we make constant progress. Having participated in a lot of hackathons prior to this one, I am very surprised by the energy levels of the mentors at Societe Generale.

To conclude, I would like to thank HackerEarth, Societe Generale, mentors and most importantly Phani Srinath and Supreeth Manyam for their fantastic work during the weekend. Great work guys! If not for any of the above, I am sure that weekend wouldn’t have been so memorable.

Our team with Societe Generale India CEO

And yes… we partied long and hard that night!

This post was originally published here.

Descriptive statistics with Python-NumPy

Is it gonna rain today? Should I take my umbrella to the office or not? To know the answer to such questions we will just take out our phone and check the weather forecast. How is this done? There are computer models which use statistics to compare weather conditions from the past with the current conditions to predict future weather conditions. From studying the amount of fluoride that is safe in our toothpaste to predicting the future stock rates, everything requires statistics. Data is everything in statistics. Calculating the range, median, and mode of the data set is all a part of descriptive statistics.

Data representation, manipulation, and visualization are key components in statistics. You can read about it here.

The next important step is analyzing the data, which can be done using both descriptive and inferential statistics. Both descriptive and inferential statistics are used to analyze results and draw conclusions in most of the research studies conducted on groups of people.

Through this article, we will learn descriptive statistics using Python.

Machine learning challenge, ML challenge

Introduction

Descriptive statistics describe the basic and important features of data. Descriptive statistics help simplify and summarize large amounts of data in a sensible manner. For instance, consider the Cumulative Grade Point Index (CGPI), which is used to describe the general performance of a student across a wide range of course experiences.

Descriptive statistics involve evaluating measures of center (centrality measures) and measures of dispersion (spread).

descriptive statistics

Centrality measures

Centrality measures give us an estimate of the center of a distribution. It gives us a sense of a typical value we would expect to see. The three major measures of center include the mean, median, and mode.

Machine Learning and Auto-Evaluation

Machine Learning

In very simple terms, Machine Learning is about training or teaching computers to take decisions or actions without explicitly programming them. For example, whenever you read a tweet or movie review, you can figure out if the views expressed are positive or negative. But can you teach a computer to determine the sentiment of that text? This has many real-life applications. For instance, when Donald Trump makes a speech, Twitter responds with a range of sentiments, and his campaign team can assess the overall sentiment using machine learning.

Another example: Baidu predicted that Germany would win the 2014 World Cup even before the match was played.

Weather Problem

Consider this small dataset of favorable weather conditions for playing a game. The goal is to forecast whether one can play the game based on the given conditions.

Outlook Temperature Humidity Windy Play
Sunny Hot High False No
Rainy Mild High False Yes
Sunny Cool Normal False Yes

Definitions

Feature/Attribute: Outlook, Temperature, Humidity, and Windy are features or attributes that influence the outcome.

Outcome/Target: The result to be predicted, i.e., whether you can play or not.

Vector: A row in the dataset representing an ordered collection of features (e.g., Sunny, Hot, High, False).

ML Model: The algorithm or process generated from the learning process (e.g., Decision Trees, SVM, Naive Bayes).

Error Metric/Evaluation Metric: Used to assess the accuracy of an ML model’s predictions. Different types exist for different problems.

Supporting ML Problems on HackerEarth

HackerEarth’s ML platform supports a typical machine learning flow. A dataset is split into training and test sets. Users train their models on the training set and predict outcomes on the test set. The test set does not include the target variable.

Example Dataset

Outlook Temperature Humidity Windy Play
SunnyHotHighFalseNo
RainyMildHighFalseYes
SunnyCoolNormalFalseYes
OvercastHotHighFalseYes
RainyMildHighFalseYes
OvercastHotNormalFalseYes
SunnyMildNormalTrueYes
SunnyMildHighFalseNo
OvercastCoolNormalTrueYes
RainyMildHighTrueYes

Train Dataset (train.csv)

Outlook Temperature Humidity Windy Play
SunnyHotHighFalseNo
RainyMildHighFalseYes
SunnyCoolNormalFalseYes
OvercastHotHighFalseYes
RainyMildHighFalseYes
OvercastHotNormalFalseYes

Test Dataset (test.csv)

Id Outlook Temperature Humidity Windy
1SunnyMildNormalTrue
2SunnyMildHighFalse
3OvercastCoolNormalTrue
4RainyMildHighTrue

Notice the absence of the target variable in the test data.

User Prediction File (user_prediction.csv)

Id Play
1Yes
2Yes
3No
4No

Correct Prediction File (correct_prediction.csv)

Id Play
1Yes
2No
3Yes
4Yes

Evaluation Metric

During the contest, only 50% of the test dataset is used for evaluation to discourage overfitting. The evaluation metric is defined as:

Score = Number of correct predictions / Total rows

In this case, only ID 1 is predicted correctly out of the first two, so:

Score online = 1 / 2 = 0.5

After the contest, the model is evaluated on the full test dataset:

Score offline = 1 / 4 = 0.25

This demonstrates how overfitting can reduce real-world model performance. Online evaluations using partial data help encourage more generalizable solutions.

In the Spotlight

Technical Screening Guide: All You Need To Know

Read this guide and learn how you can establish a less frustrating developer hiring workflow for both hiring teams and candidates.
Read More
Top Products

Explore HackerEarth’s top products for Hiring & Innovation

Discover powerful tools designed to streamline hiring, assess talent efficiently, and run seamless hackathons. Explore HackerEarth’s top products that help businesses innovate and grow.
Frame
Hackathons
Engage global developers through innovation
Arrow
Frame 2
Assessments
AI-driven advanced coding assessments
Arrow
Frame 3
FaceCode
Real-time code editor for effective coding interviews
Arrow
Frame 4
L & D
Tailored learning paths for continuous assessments
Arrow
Authors

Meet our Authors

Get to know the experts behind our content. From industry leaders to tech enthusiasts, our authors share valuable insights, trends, and expertise to keep you informed and inspired.
Ruehie Jaiya Karri
Kumari Trishya

7 Tech Recruiting Trends To Watch Out For In 2024

The last couple of years transformed how the world works and the tech industry is no exception. Remote work, a candidate-driven market, and automation are some of the tech recruiting trends born out of the pandemic.

While accepting the new reality and adapting to it is the first step, keeping up with continuously changing hiring trends in technology is the bigger challenge right now.

What does 2024 hold for recruiters across the globe? What hiring practices would work best in this post-pandemic world? How do you stay on top of the changes in this industry?

The answers to these questions will paint a clearer picture of how to set up for success while recruiting tech talent this year.

7 tech recruiting trends for 2024

6 Tech Recruiting Trends To Watch Out For In 2022

Recruiters, we’ve got you covered. Here are the tech recruiting trends that will change the way you build tech teams in 2024.

Trend #1—Leverage data-driven recruiting

Data-driven recruiting strategies are the answer to effective talent sourcing and a streamlined hiring process.

Talent acquisition leaders need to use real-time analytics like pipeline growth metrics, offer acceptance rates, quality and cost of new hires, and candidate feedback scores to reduce manual work, improve processes, and hire the best talent.

The key to capitalizing on talent market trends in 2024 is data. It enables you to analyze what’s working and what needs refinement, leaving room for experimentation.

Trend #2—Have impactful employer branding

98% of recruiters believe promoting company culture helps sourcing efforts as seen in our 2021 State Of Developer Recruitment report.

Having a strong employer brand that supports a clear Employer Value Proposition (EVP) is crucial to influencing a candidate’s decision to work with your company. Perks like upskilling opportunities, remote work, and flexible hours are top EVPs that attract qualified candidates.

A clear EVP builds a culture of balance, mental health awareness, and flexibility—strengthening your employer brand with candidate-first policies.

Trend #3—Focus on candidate-driven market

The pandemic drastically increased the skills gap, making tech recruitment more challenging. With the severe shortage of tech talent, candidates now hold more power and can afford to be selective.

Competitive pay is no longer enough. Use data to understand what candidates want—work-life balance, remote options, learning opportunities—and adapt accordingly.

Recruiters need to think creatively to attract and retain top talent.


Recommended read: What NOT To Do When Recruiting Fresh Talent


Trend #4—Have a diversity and inclusion oriented company culture

Diversity and inclusion have become central to modern recruitment. While urgent hiring can delay D&I efforts, long-term success depends on inclusive teams. Our survey shows that 25.6% of HR professionals believe a diverse leadership team helps build stronger pipelines and reduces bias.

McKinsey’s Diversity Wins report confirms this: top-quartile gender-diverse companies see 25% higher profitability, and ethnically diverse teams show 36% higher returns.

It's refreshing to see the importance of an inclusive culture increasing across all job-seeking communities, especially in tech. This reiterates that D&I is a must-have, not just a good-to-have.

—Swetha Harikrishnan, Sr. HR Director, HackerEarth

Recommended read: Diversity And Inclusion in 2022 - 5 Essential Rules To Follow


Trend #5—Embed automation and AI into your recruitment systems

With the rise of AI tools like ChatGPT, automation is being adopted across every business function—including recruiting.

Manual communication with large candidate pools is inefficient. In 2024, recruitment automation and AI-powered platforms will automate candidate nurturing and communication, providing a more personalized experience while saving time.

Trend #6—Conduct remote interviews

With 32.5% of companies planning to stay remote, remote interviewing is here to stay.

Remote interviews expand access to global talent, reduce overhead costs, and increase flexibility—making the hiring process more efficient for both recruiters and candidates.

Trend #7—Be proactive in candidate engagement

Delayed responses or lack of updates can frustrate candidates and impact your brand. Proactive communication and engagement with both active and passive candidates are key to successful recruiting.

As recruitment evolves, proactive candidate engagement will become central to attracting and retaining talent. In 2023 and beyond, companies must engage both active and passive candidates through innovative strategies and technologies like chatbots and AI-powered systems. Building pipelines and nurturing relationships will enhance employer branding and ensure long-term hiring success.

—Narayani Gurunathan, CEO, PlaceNet Consultants

Recruiting Tech Talent Just Got Easier With HackerEarth

Recruiting qualified tech talent is tough—but we’re here to help. HackerEarth for Enterprises offers an all-in-one suite that simplifies sourcing, assessing, and interviewing developers.

Our tech recruiting platform enables you to:

  • Tap into a 6 million-strong developer community
  • Host custom hackathons to engage talent and boost your employer brand
  • Create online assessments to evaluate 80+ tech skills
  • Use dev-friendly IDEs and proctoring for reliable evaluations
  • Benchmark candidates against a global community
  • Conduct live coding interviews with FaceCode, our collaborative coding interview tool
  • Guide upskilling journeys via our Learning and Development platform
  • Integrate seamlessly with all leading ATS systems
  • Access 24/7 support with a 95% satisfaction score

Recommended read: The A-Zs Of Tech Recruiting - A Guide


Staying ahead of tech recruiting trends, improving hiring processes, and adapting to change is the way forward in 2024. Take note of the tips in this article and use them to build a future-ready hiring strategy.

Ready to streamline your tech recruiting? Try HackerEarth for Enterprises today.

(Part 2) Essential Questions To Ask When Interviewing Developers In 2021

The first part of this blog stresses the importance of asking the right technical interview questions to assess a candidate’s coding skills. But that alone is not enough. If you want to hire the crème de la crème of the developer talent out there, you have to look for a well-rounded candidate.

Honest communication, empathy, and passion for their work are equally important as a candidate’s technical knowledge. Soft skills are like the cherry on top. They set the best of the candidates apart from the rest.

Re-examine how you are vetting your candidates. Identify the gaps in your interviews. Once you start addressing these gaps, you find developers who have the potential to be great. And those are exactly the kind of people that you want to work with!

Let’s get to it, shall we?

Hire great developers

What constitutes a good interview question?

An ideal interview should reveal a candidate’s personality along with their technical knowledge. To formulate a comprehensive list of questions, keep in mind three important characteristics.

  • Questions are open-ended – questions like, “What are some of the programming languages you’re comfortable with,” instead of “Do you know this particular programming language” makes the candidate feel like they’re in control. It is also a chance to let them reply to your question in their own words.
  • They address the behavioral aspects of a candidate – ensure you have a few questions on your list that allow a candidate to describe a situation. A situation where a client was unhappy or a time when the developer learned a new technology. Such questions help you assess if the candidate is a good fit for the team.
  • There is no right or wrong answer – it is important to have a structured interview process in place. But this does not mean you have a list of standard answers in mind that you’re looking for. How candidates approach your questions shows you whether they have the makings of a successful candidate. Focus on that rather than on the actual answer itself.

Designing a conversation around these buckets of interview questions brings you to my next question, “What should you look for in each candidate to spot the best ones?”

Hire GREAT developers by asking the right questions

Before we dive deep into the interview questions, we have to think about a few things that have changed. COVID-19 has rendered working from home the new normal for the foreseeable future. As a recruiter, the onus falls upon you to understand whether the developer is comfortable working remotely and has the relevant resources to achieve maximum productivity.

#1 How do you plan your day?

Remote work gives employees the option to be flexible. You don’t have to clock in 9 hours a day as long as you get everything done on time. A developer who hasn’t always been working remotely, but has a routine in place, understands the pitfalls of working from home. It is easy to get distracted and having a schedule to fall back on ensures good productivity.

#2 Do you have experience using tools for collaboration and remote work?

Working from home reduces human interaction heavily. There is no way to just go up to your teammate’s desk and clarify issues. Virtual communication is key to getting work done. Look for what kind of remote working tools your candidate is familiar with and if they know what collaborative tools to use for different tasks.

Value-based interview questions to ask

We went around and spoke to our engineering team, and the recruiting team to see what questions they abide by; what they think makes any candidate tick.

The result? – a motley group of questions that aim to reveal the candidate’s soft skills, in addition to typical technical interview questions and test tasks.


Recommended read: How Recruiting The Right Tech Talent Can Solve Tech Debt


#3 Please describe three recent projects that you worked on. What were the most interesting and challenging parts?

This is an all-encompassing question in that it lets the candidate explain at length about their work ethic—thought process, handling QA, working with a team, and managing user feedback. This also lets you dig enough to assess whether the candidate is taking credit for someone else's work or not.

#4 You’ve worked long and hard to deliver a complex feature for a client and they say it’s not what they asked for. How would you take it?

A good developer will take it in their stride, work closely with the client to find the point of disconnect, and sort out the issue. There are so many things that could go wrong or not be to the client’s liking, and it falls on the developer to remain calm and create solutions.

#5 What new programming languages or technologies have you learned recently?

While being certified in many programming languages doesn't guarantee a great developer, it still is an important technical interview question to ask. It helps highlight a thirst for knowledge and shows that the developer is eager to learn new things.

#6 What does the perfect release look like? Who is involved and what is your role?

Have the developer take you through each phase of a recent software development lifecycle. Ask them to explain their specific role in each phase in this release. This will give you an excellent perspective into a developer’s mind. Do they talk about the before and after of the release? A skilled developer would. The chances of something going wrong in a release are very high. How would the developer react? Will they be able to handle the pressure?


SUBSCRIBE to the HackerEarth blog and enrich your monthly reading with our free e-newsletter – Fresh, insightful and awesome articles straight into your inbox from around the tech recruiting world!


#7 Tell me about a time when you had to convince your lead to try a different approach?

As an example of a behavioral interview question, this is a good one. The way a developer approaches this question speaks volumes about how confident they are expressing their views, and how succinct they are in articulating those views.

#8 What have you done with all the extra hours during the pandemic?

Did you binge-watch your way through the pandemic? I’m sure every one of us has done this. Indulge in a lighthearted conversation with your candidate. This lets them talk about something they are comfortable with. Maybe they learned a new skill or took up a hobby. Get to know a candidate’s interests and little pleasures for a more rounded evaluation.

Over to you! Now that you know what aspects of a candidate to focus on, you are well-equipped to bring out the best in each candidate in their interviews. A mix of strong technical skills and interpersonal qualities is how you spot good developers for your team.

If you have more pressing interview questions to add to this list of ours, please write to us at contact@hackerearth.com.

(Part 1) Essential Questions To Ask When Recruiting Developers In 2021

The minute a developer position opens up, recruiters feel a familiar twinge of fear run down their spines. They recall their previous interview experiences, and how there seems to be a blog post a month that goes viral about bad developer interviews.

While hiring managers, especially the picky ones, would attribute this to a shortage of talented developers, what if the time has come to rethink your interview process? What if recruiters and hiring managers put too much stock into bringing out the technical aspects of each candidate and don’t put enough emphasis on their soft skills?

A report by Robert Half shows that 86% of technology leaders say it’s challenging to find IT talent. Interviewing developers should be a rewarding experience, not a challenging one. If you don’t get caught up in asking specific questions and instead design a simple conversation to gauge a candidate’s way of thinking, it throws up a lot of good insight and makes it fun too.

Developer Hiring Statistics

Asking the right technical interview questions when recruiting developers is important but so is clear communication, good work ethic, and alignment with your organization’s goals.

Let us first see what kind of technical interview questions are well-suited to revealing the coding skills and knowledge of any developer, and then tackle the behavioral aspects of the candidate that sets them apart from the rest.

Recruit GREAT developers by asking the right questions

Here are some technical interview questions that you should ask potential software engineers when interviewing.

#1 Write an algorithm for the following

  1. Minimum Stack - Design a stack that provides 4 functions - push(item), pop, peek, and minimum, all in constant order time complexity. Then move on to coding the actual solution.
  2. Kth Largest Element in an array - This is a standard problem with multiple solutions of best time complexity orders where N log(K) is a common one and O(N) + K log(N) is a lesser-known order. Both solutions are acceptable, not directly comparable to each other, and better than N log(N), which is sorting an array and fetching the Kth element.
  3. Top View of a Binary Tree - Given a root node of the binary tree, return the set of all elements that will get wet if it rains on the tree. Nodes having any nodes directly above them will not get wet.
  4. Internal implementation of a hashtable like a map/dictionary - A candidate needs to specify how key-value pairs are stored, hashing is used and collisions are handled. A good developer not only knows how to use this concept but also how it works. If the developer also knows how the data structure scales when the number of records increases in the hashtable, that is a bonus.

Algorithms demonstrate a candidate’s ability to break down a complex problem into steps. Reasoning and pattern recognition capabilities are some more factors to look for when assessing a candidate. A good candidate can code his thought process of the algorithm finalized during the discussion.


Looking for a great place to hire developers in the US? Try Jooble!


#2 Formulate solutions for the below low-level design (LLD) questions

  • What is LLD? In your own words, specify the different aspects covered in LLD.
  • Design a movie ticket booking application like BookMyShow. Ensure that your database schema is tailored for a theatre with multiple screens and takes care of booking, seat availability, seat arrangement, and seat locking. Your solution does not have to extend to the payment option.
  • Design a basic social media application. Design database schema and APIs for a platform like Twitter with features for following a user, tweeting a post, seeing your tweet, and seeing a user's tweet.

Such questions do not have a right or wrong answer. They primarily serve to reveal a developer’s thought process and the way they approach a problem.


Recommended read: Hardest Tech Roles to Fill (+ solutions!)


#3 Some high-level design (HLD) questions

  • What do you understand by HLD? Can you specify the difference between LLD and HLD?
  • Design a social media application. In addition to designing a platform like Twitter with features for following a user, tweeting a post, seeing your tweet, and seeing a user's tweet, design a timeline. After designing a timeline where you can see your followers’ tweets, scale it for a larger audience. If you still have time, try to scale it for a celebrity use case.
  • Design for a train ticket booking application like IRCTC. Incorporate auth, features to choose start and end stations, view available trains and available seats between two stations, save reservation of seats from start to end stations, and lock them till payment confirmation.
  • How will you design a basic relational database? The database should support tables, columns, basic field types like integer and text, foreign keys, and indexes. The way a developer approaches this question is important. A good developer designs a solution around storage and memory management.
Here’s a pro-tip for you. LLD questions can be answered by both beginners and experienced developers. Mostly, senior developers can be expected to answer HLD questions. Choose your interview questions set wisely, and ask questions relevant to your candidate’s experience.

#4 Have you ever worked with SQL? Write queries for a specific use case that requires multiple joins.

Example: Create a table with separate columns for student name, subject, and marks scored. Return student names and ranks of each student. The rank of a student depends on the total of marks in all subjects.

Not all developers would have experience working with SQL but some knowledge about how data is stored/structured is useful. Developers should be familiar with simple concepts like joins, retrieval queries, and the basics of DBMS.

#5 What do you think is wrong with this code?

Instead of asking developer candidates to write code on a piece of paper (which is outdated, anyway), ask them to debug existing code. This is another way to assess their technical skills. Place surreptitious errors in the code and evaluate their attention to detail.

Now that you know exactly what technical skills to look for and when questions to ask when interviewing developers, the time has come to assess the soft skills of these candidates. Part 2 of this blog throws light on the how and why of evaluating candidates based on their communication skills, work ethic, and alignment with the company’s goals.

View all

Best Pre-Employment Assessments: Optimizing Your Hiring Process for 2024

In today's competitive talent market, attracting and retaining top performers is crucial for any organization's success. However, traditional hiring methods like relying solely on resumes and interviews may not always provide a comprehensive picture of a candidate's skills and potential. This is where pre-employment assessments come into play.

What is Pre-Employement Assessment?

Pre-employment assessments are standardized tests and evaluations administered to candidates before they are hired. These assessments can help you objectively measure a candidate's knowledge, skills, abilities, and personality traits, allowing you to make data-driven hiring decisions.

By exploring and evaluating the best pre-employment assessment tools and tests available, you can:

  • Improve the accuracy and efficiency of your hiring process.
  • Identify top talent with the right skills and cultural fit.
  • Reduce the risk of bad hires.
  • Enhance the candidate experience by providing a clear and objective evaluation process.

This guide will provide you with valuable insights into the different types of pre-employment assessments available and highlight some of the best tools, to help you optimize your hiring process for 2024.

Why pre-employment assessments are key in hiring

While resumes and interviews offer valuable insights, they can be subjective and susceptible to bias. Pre-employment assessments provide a standardized and objective way to evaluate candidates, offering several key benefits:

  • Improved decision-making:

    By measuring specific skills and knowledge, assessments help you identify candidates who possess the qualifications necessary for the job.

  • Reduced bias:

    Standardized assessments mitigate the risks of unconscious bias that can creep into traditional interview processes.

  • Increased efficiency:

    Assessments can streamline the initial screening process, allowing you to focus on the most promising candidates.

  • Enhanced candidate experience:

    When used effectively, assessments can provide candidates with a clear understanding of the required skills and a fair chance to showcase their abilities.

Types of pre-employment assessments

There are various types of pre-employment assessments available, each catering to different needs and objectives. Here's an overview of some common types:

1. Skill Assessments:

  • Technical Skills: These assessments evaluate specific technical skills and knowledge relevant to the job role, such as programming languages, software proficiency, or industry-specific expertise. HackerEarth offers a wide range of validated technical skill assessments covering various programming languages, frameworks, and technologies.
  • Soft Skills: These employment assessments measure non-technical skills like communication, problem-solving, teamwork, and critical thinking, crucial for success in any role.

2. Personality Assessments:

These employment assessments can provide insights into a candidate's personality traits, work style, and cultural fit within your organization.

3. Cognitive Ability Tests:

These tests measure a candidate's general mental abilities, such as reasoning, problem-solving, and learning potential.

4. Integrity Assessments:

These employment assessments aim to identify potential risks associated with a candidate's honesty, work ethic, and compliance with company policies.

By understanding the different types of assessments and their applications, you can choose the ones that best align with your specific hiring needs and ensure you hire the most qualified and suitable candidates for your organization.

Leading employment assessment tools and tests in 2024

Choosing the right pre-employment assessment tool depends on your specific needs and budget. Here's a curated list of some of the top pre-employment assessment tools and tests available in 2024, with brief overviews:

  • HackerEarth:

    A comprehensive platform offering a wide range of validated skill assessments in various programming languages, frameworks, and technologies. It also allows for the creation of custom assessments and integrates seamlessly with various recruitment platforms.

  • SHL:

    Provides a broad selection of assessments, including skill tests, personality assessments, and cognitive ability tests. They offer customizable solutions and cater to various industries.

  • Pymetrics:

    Utilizes gamified assessments to evaluate cognitive skills, personality traits, and cultural fit. They offer a data-driven approach and emphasize candidate experience.

  • Wonderlic:

    Offers a variety of assessments, including the Wonderlic Personnel Test, which measures general cognitive ability. They also provide aptitude and personality assessments.

  • Harver:

    An assessment platform focusing on candidate experience with video interviews, gamified assessments, and skills tests. They offer pre-built assessments and customization options.

Remember: This list is not exhaustive, and further research is crucial to identify the tool that aligns best with your specific needs and budget. Consider factors like the types of assessments offered, pricing models, integrations with your existing HR systems, and user experience when making your decision.

Choosing the right pre-employment assessment tool

Instead of full individual tool reviews, consider focusing on 2–3 key platforms. For each platform, explore:

  • Target audience: Who are their assessments best suited for (e.g., technical roles, specific industries)?
  • Types of assessments offered: Briefly list the available assessment categories (e.g., technical skills, soft skills, personality).
  • Key features: Highlight unique functionalities like gamification, custom assessment creation, or seamless integrations.
  • Effectiveness: Briefly mention the platform's approach to assessment validation and reliability.
  • User experience: Consider including user reviews or ratings where available.

Comparative analysis of assessment options

Instead of a comprehensive comparison, consider focusing on specific use cases:

  • Technical skills assessment:

    Compare HackerEarth and Wonderlic based on their technical skill assessment options, focusing on the variety of languages/technologies covered and assessment formats.

  • Soft skills and personality assessment:

    Compare SHL and Pymetrics based on their approaches to evaluating soft skills and personality traits, highlighting any unique features like gamification or data-driven insights.

  • Candidate experience:

    Compare Harver and Wonderlic based on their focus on candidate experience, mentioning features like video interviews or gamified assessments.

Additional tips:

  • Encourage readers to visit the platforms' official websites for detailed features and pricing information.
  • Include links to reputable third-party review sites where users share their experiences with various tools.

Best practices for using pre-employment assessment tools

Integrating pre-employment assessments effectively requires careful planning and execution. Here are some best practices to follow:

  • Define your assessment goals:

    Clearly identify what you aim to achieve with assessments. Are you targeting specific skills, personality traits, or cultural fit?

  • Choose the right assessments:

    Select tools that align with your defined goals and the specific requirements of the open position.

  • Set clear expectations:

    Communicate the purpose and format of the assessments to candidates in advance, ensuring transparency and building trust.

  • Integrate seamlessly:

    Ensure your chosen assessment tool integrates smoothly with your existing HR systems and recruitment workflow.

  • Train your team:

    Equip your hiring managers and HR team with the knowledge and skills to interpret assessment results effectively.

Interpreting assessment results accurately

Assessment results offer valuable data points, but interpreting them accurately is crucial for making informed hiring decisions. Here are some key considerations:

  • Use results as one data point:

    Consider assessment results alongside other information, such as resumes, interviews, and references, for a holistic view of the candidate.

  • Understand score limitations:

    Don't solely rely on raw scores. Understand the assessment's validity and reliability and the potential for cultural bias or individual test anxiety.

  • Look for patterns and trends:

    Analyze results across different assessments and identify consistent patterns that align with your desired candidate profile.

  • Focus on potential, not guarantees:

    Assessments indicate potential, not guarantees of success. Use them alongside other evaluation methods to make well-rounded hiring decisions.

Choosing the right pre-employment assessment tools

Selecting the most suitable pre-employment assessment tool requires careful consideration of your organization's specific needs. Here are some key factors to guide your decision:

  • Industry and role requirements:

    Different industries and roles demand varying skill sets and qualities. Choose assessments that target the specific skills and knowledge relevant to your open positions.

  • Company culture and values:

    Align your assessments with your company culture and values. For example, if collaboration is crucial, look for assessments that evaluate teamwork and communication skills.

  • Candidate experience:

    Prioritize tools that provide a positive and smooth experience for candidates. This can enhance your employer brand and attract top talent.

Budget and accessibility considerations

Budget and accessibility are essential factors when choosing pre-employment assessments:

  • Budget:

    Assessment tools come with varying pricing models (subscriptions, pay-per-use, etc.). Choose a tool that aligns with your budget and offers the functionalities you need.

  • Accessibility:

    Ensure the chosen assessment is accessible to all candidates, considering factors like language options, disability accommodations, and internet access requirements.

Additional Tips:

  • Free trials and demos: Utilize free trials or demos offered by assessment platforms to experience their functionalities firsthand.
  • Consult with HR professionals: Seek guidance from HR professionals or recruitment specialists with expertise in pre-employment assessments.
  • Read user reviews and comparisons: Gain insights from other employers who use various assessment tools.

By carefully considering these factors, you can select the pre-employment assessment tool that best aligns with your organizational needs, budget, and commitment to an inclusive hiring process.

Remember, pre-employment assessments are valuable tools, but they should not be the sole factor in your hiring decisions. Use them alongside other evaluation methods and prioritize building a fair and inclusive hiring process that attracts and retains top talent.

Future trends in pre-employment assessments

The pre-employment assessment landscape is constantly evolving, with innovative technologies and practices emerging. Here are some potential future trends to watch:

  • Artificial intelligence (AI):

    AI-powered assessments can analyze candidate responses, written work, and even resumes, using natural language processing to extract relevant insights and identify potential candidates.

  • Adaptive testing:

    These assessments adjust the difficulty level of questions based on the candidate's performance, providing a more efficient and personalized evaluation.

  • Micro-assessments:

    Short, focused assessments delivered through mobile devices can assess specific skills or knowledge on-the-go, streamlining the screening process.

  • Gamification:

    Engaging and interactive game-based elements can make the assessment experience more engaging and assess skills in a realistic and dynamic way.

Conclusion

Pre-employment assessments, when used thoughtfully and ethically, can be a powerful tool to optimize your hiring process, identify top talent, and build a successful workforce for your organization. By understanding the different types of assessments available, exploring top-rated tools like HackerEarth, and staying informed about emerging trends, you can make informed decisions that enhance your ability to attract, evaluate, and hire the best candidates for the future.

Tech Layoffs: What To Expect In 2024

Layoffs in the IT industry are becoming more widespread as companies fight to remain competitive in a fast-changing market; many turn to layoffs as a cost-cutting measure. Last year, 1,000 companies including big tech giants and startups, laid off over two lakhs of employees. But first, what are layoffs in the tech business, and how do they impact the industry?

Tech layoffs are the termination of employment for some employees by a technology company. It might happen for various reasons, including financial challenges, market conditions, firm reorganization, or the after-effects of a pandemic. While layoffs are not unique to the IT industry, they are becoming more common as companies look for methods to cut costs while remaining competitive.

The consequences of layoffs in technology may be catastrophic for employees who lose their jobs and the firms forced to make these difficult decisions. Layoffs can result in the loss of skill and expertise and a drop in employee morale and productivity. However, they may be required for businesses to stay afloat in a fast-changing market.

This article will examine the reasons for layoffs in the technology industry, their influence on the industry, and what may be done to reduce their negative impacts. We will also look at the various methods for tracking tech layoffs.

What are tech layoffs?

The term "tech layoff" describes the termination of employees by an organization in the technology industry. A company might do this as part of a restructuring during hard economic times.

In recent times, the tech industry has witnessed a wave of significant layoffs, affecting some of the world’s leading technology companies, including Amazon, Microsoft, Meta (formerly Facebook), Apple, Cisco, SAP, and Sony. These layoffs are a reflection of the broader economic challenges and market adjustments facing the sector, including factors like slowing revenue growth, global economic uncertainties, and the need to streamline operations for efficiency.

Each of these tech giants has announced job cuts for various reasons, though common themes include restructuring efforts to stay competitive and agile, responding to over-hiring during the pandemic when demand for tech services surged, and preparing for a potentially tough economic climate ahead. Despite their dominant positions in the market, these companies are not immune to the economic cycles and technological shifts that influence operational and strategic decisions, including workforce adjustments.

This trend of layoffs in the tech industry underscores the volatile nature of the tech sector, which is often at the mercy of rapid changes in technology, consumer preferences, and the global economy. It also highlights the importance of adaptability and resilience for companies and employees alike in navigating the uncertainties of the tech landscape.

Causes for layoffs in the tech industry

Why are tech employees suffering so much?

Yes, the market is always uncertain, but why resort to tech layoffs?

Various factors cause tech layoffs, including company strategy changes, market shifts, or financial difficulties. Companies may lay off employees if they need help to generate revenue, shift their focus to new products or services, or automate certain jobs.

In addition, some common reasons could be:

Financial struggles

Currently, the state of the global market is uncertain due to economic recession, ongoing war, and other related phenomena. If a company is experiencing financial difficulties, only sticking to pay cuts may not be helpful—it may need to reduce its workforce to cut costs.


Also, read: 6 Steps To Create A Detailed Recruiting Budget (Template Included)


Changes in demand

The tech industry is constantly evolving, and companies would have to adjust their workforce to meet changing market conditions. For instance, companies are adopting remote work culture, which surely affects on-premises activity, and companies could do away with some number of tech employees at the backend.

Restructuring

Companies may also lay off employees as part of a greater restructuring effort, such as spinning off a division or consolidating operations.

Automation

With the advancement in technology and automation, some jobs previously done by human labor may be replaced by machines, resulting in layoffs.

Mergers and acquisitions

When two companies merge, there is often overlap in their operations, leading to layoffs as the new company looks to streamline its workforce.

But it's worth noting that layoffs are not exclusive to the tech industry and can happen in any industry due to uncertainty in the market.

Will layoffs increase in 2024?

It is challenging to estimate the rise or fall of layoffs. The overall state of the economy, the health of certain industries, and the performance of individual companies will play a role in deciding the degree of layoffs in any given year.

But it is also seen that, in the first 15 days of this year, 91 organizations laid off over 24,000 tech workers, and over 1,000 corporations cut down more than 150,000 workers in 2022, according to an Economic Times article.

The COVID-19 pandemic caused a huge economic slowdown and forced several businesses to downsize their employees. However, some businesses rehired or expanded their personnel when the world began to recover.

So, given the current level of economic uncertainty, predicting how the situation will unfold is difficult.


Also, read: 4 Images That Show What Developers Think Of Layoffs In Tech


What types of companies are prone to tech layoffs?

2023 Round Up Of Layoffs In Big Tech

Tech layoffs can occur in organizations of all sizes and various areas.

Following are some examples of companies that have experienced tech layoffs in the past:

Large tech firms

Companies such as IBM, Microsoft, Twitter, Better.com, Alibaba, and HP have all experienced layoffs in recent years as part of restructuring initiatives or cost-cutting measures.

Market scenarios are still being determined after Elon Musk's decision to lay off employees. Along with tech giants, some smaller companies and startups have also been affected by layoffs.

Startups

Because they frequently work with limited resources, startups may be forced to lay off staff if they cannot get further funding or need to pivot due to market downfall.

Small and medium-sized businesses

Small and medium-sized businesses face layoffs due to high competition or if the products/services they offer are no longer in demand.

Companies in certain industries

Some sectors of the technological industry, such as the semiconductor industry or automotive industry, may be more prone to layoffs than others.

Companies that lean on government funding

Companies that rely significantly on government contracts may face layoffs if the government cuts technology spending or contracts are not renewed.

How to track tech layoffs?

You can’t stop tech company layoffs, but you should be keeping track of them. We, HR professionals and recruiters, can also lend a helping hand in these tough times by circulating “layoff lists” across social media sites like LinkedIn and Twitter to help people land jobs quicker. Firefish Software put together a master list of sources to find fresh talent during the layoff period.

Because not all layoffs are publicly disclosed, tracking tech industry layoffs can be challenging, and some may go undetected. There are several ways to keep track of tech industry layoffs:

Use tech layoffs tracker

Layoff trackers like thelayoff.com and layoffs.fyi provide up-to-date information on layoffs.

In addition, they aid in identifying trends in layoffs within the tech industry. It can reveal which industries are seeing the most layoffs and which companies are the most affected.

Companies can use layoff trackers as an early warning system and compare their performance to that of other companies in their field.

News articles

Because many news sites cover tech layoffs as they happen, keeping a watch on technology sector stories can provide insight into which organizations are laying off employees and how many individuals have been affected.

Social media

Organizations and employees frequently publish information about layoffs in tech on social media platforms; thus, monitoring companies' social media accounts or following key hashtags can provide real-time updates regarding layoffs.

Online forums and communities

There are online forums and communities dedicated to discussing tech industry news, and they can be an excellent source of layoff information.

Government reports

Government agencies such as the Bureau of Labor Statistics (BLS) publish data on layoffs and unemployment, which can provide a more comprehensive picture of the technology industry's status.

How do companies reduce tech layoffs?

Layoffs in tech are hard – for the employee who is losing their job, the recruiter or HR professional who is tasked with informing them, and the company itself. So, how can we aim to avoid layoffs? Here are some ways to minimize resorting to letting people go:

Salary reductions

Instead of laying off employees, businesses can lower the salaries or wages of all employees. It can be accomplished by instituting compensation cuts or salary freezes.

Implementing a hiring freeze

Businesses can halt employing new personnel to cut costs. It can be a short-term solution until the company's financial situation improves.


Also, read: What Recruiters Can Focus On During A Tech Hiring Freeze


Non-essential expense reduction

Businesses might search for ways to cut or remove non-essential expenses such as travel, training, and office expenses.

Reducing working hours

Companies can reduce employee working hours to save money, such as implementing a four-day workweek or a shorter workday.

These options may not always be viable and may have their problems, but before laying off, a company owes it to its people to consider every other alternative, and formulate the best solution.

Tech layoffs to bleed into this year

While we do not know whether this trend will continue or subside during 2023, we do know one thing. We have to be prepared for a wave of layoffs that is still yet to hit. As of last month, Layoffs.fyi had already tracked 170+ companies conducting 55,970 layoffs in 2023.

So recruiters, let’s join arms, distribute those layoff lists like there’s no tomorrow, and help all those in need of a job! :)

What is Headhunting In Recruitment?: Types &amp; How Does It Work?

In today’s fast-paced world, recruiting talent has become increasingly complicated. Technological advancements, high workforce expectations and a highly competitive market have pushed recruitment agencies to adopt innovative strategies for recruiting various types of talent. This article aims to explore one such recruitment strategy – headhunting.

What is Headhunting in recruitment?

In headhunting, companies or recruitment agencies identify, engage and hire highly skilled professionals to fill top positions in the respective companies. It is different from the traditional process in which candidates looking for job opportunities approach companies or recruitment agencies. In headhunting, executive headhunters, as recruiters are referred to, approach prospective candidates with the hiring company’s requirements and wait for them to respond. Executive headhunters generally look for passive candidates, those who work at crucial positions and are not on the lookout for new work opportunities. Besides, executive headhunters focus on filling critical, senior-level positions indispensable to companies. Depending on the nature of the operation, headhunting has three types. They are described later in this article. Before we move on to understand the types of headhunting, here is how the traditional recruitment process and headhunting are different.

How do headhunting and traditional recruitment differ from each other?

Headhunting is a type of recruitment process in which top-level managers and executives in similar positions are hired. Since these professionals are not on the lookout for jobs, headhunters have to thoroughly understand the hiring companies’ requirements and study the work profiles of potential candidates before creating a list.

In the traditional approach, there is a long list of candidates applying for jobs online and offline. Candidates approach recruiters for jobs. Apart from this primary difference, there are other factors that define the difference between these two schools of recruitment.

AspectHeadhuntingTraditional RecruitmentCandidate TypePrimarily passive candidateActive job seekersApproachFocused on specific high-level rolesBroader; includes various levelsScopeproactive outreachReactive: candidates applyCostGenerally more expensive due to expertise requiredTypically lower costsControlManaged by headhuntersManaged internally by HR teams

All the above parameters will help you to understand how headhunting differs from traditional recruitment methods, better.

Types of headhunting in recruitment

Direct headhunting: In direct recruitment, hiring teams reach out to potential candidates through personal communication. Companies conduct direct headhunting in-house, without outsourcing the process to hiring recruitment agencies. Very few businesses conduct this type of recruitment for top jobs as it involves extensive screening across networks outside the company’s expanse.

Indirect headhunting: This method involves recruiters getting in touch with their prospective candidates through indirect modes of communication such as email and phone calls. Indirect headhunting is less intrusive and allows candidates to respond at their convenience.Third-party recruitment: Companies approach external recruitment agencies or executive headhunters to recruit highly skilled professionals for top positions. This method often leverages the company’s extensive contact network and expertise in niche industries.

How does headhunting work?

Finding highly skilled professionals to fill critical positions can be tricky if there is no system for it. Expert executive headhunters employ recruitment software to conduct headhunting efficiently as it facilitates a seamless recruitment process for executive headhunters. Most software is AI-powered and expedites processes like candidate sourcing, interactions with prospective professionals and upkeep of communication history. This makes the process of executive search in recruitment a little bit easier. Apart from using software to recruit executives, here are the various stages of finding high-calibre executives through headhunting.

Identifying the role

Once there is a vacancy for a top job, one of the top executives like a CEO, director or the head of the company, reach out to the concerned personnel with their requirements. Depending on how large a company is, they may choose to headhunt with the help of an external recruiting agency or conduct it in-house. Generally, the task is assigned to external recruitment agencies specializing in headhunting. Executive headhunters possess a database of highly qualified professionals who work in crucial positions in some of the best companies. This makes them the top choice of conglomerates looking to hire some of the best talents in the industry.

Defining the job

Once an executive headhunter or a recruiting agency is finalized, companies conduct meetings to discuss the nature of the role, how the company works, the management hierarchy among other important aspects of the job. Headhunters are expected to understand these points thoroughly and establish a clear understanding of their expectations and goals.

Candidate identification and sourcing

Headhunters analyse and understand the requirements of their clients and begin creating a pool of suitable candidates from their database. The professionals are shortlisted after conducting extensive research of job profiles, number of years of industry experience, professional networks and online platforms.

Approaching candidates

Once the potential candidates have been identified and shortlisted, headhunters move on to get in touch with them discreetly through various communication channels. As such candidates are already working at top level positions at other companies, executive headhunters have to be low-key while doing so.

Assessment and Evaluation

In this next step, extensive screening and evaluation of candidates is conducted to determine their suitability for the advertised position.

Interviews and negotiations

Compensation is a major topic of discussion among recruiters and prospective candidates. A lot of deliberation and negotiation goes on between the hiring organization and the selected executives which is facilitated by the headhunters.

Finalizing the hire

Things come to a close once the suitable candidates accept the job offer. On accepting the offer letter, headhunters help finalize the hiring process to ensure a smooth transition.

The steps listed above form the blueprint for a typical headhunting process. Headhunting has been crucial in helping companies hire the right people for crucial positions that come with great responsibility. However, all systems have a set of challenges no matter how perfect their working algorithm is. Here are a few challenges that talent acquisition agencies face while headhunting.

Common challenges in headhunting

Despite its advantages, headhunting also presents certain challenges:

Cost Implications: Engaging headhunters can be more expensive than traditional recruitment methods due to their specialized skills and services.

Time-Consuming Process: While headhunting can be efficient, finding the right candidate for senior positions may still take time due to thorough evaluation processes.

Market Competition: The competition for top talent is fierce; organizations must present compelling offers to attract passive candidates away from their current roles.

Although the above mentioned factors can pose challenges in the headhunting process, there are more upsides than there are downsides to it. Here is how headhunting has helped revolutionize the recruitment of high-profile candidates.

Advantages of Headhunting

Headhunting offers several advantages over traditional recruitment methods:

Access to Passive Candidates: By targeting individuals who are not actively seeking new employment, organisations can access a broader pool of highly skilled professionals.

Confidentiality: The discreet nature of headhunting protects both candidates’ current employment situations and the hiring organisation’s strategic interests.

Customized Search: Headhunters tailor their search based on the specific needs of the organization, ensuring a better fit between candidates and company culture.

Industry Expertise: Many headhunters specialise in particular sectors, providing valuable insights into market dynamics and candidate qualifications.

Conclusion

Although headhunting can be costly and time-consuming, it is one of the most effective ways of finding good candidates for top jobs. Executive headhunters face several challenges maintaining the g discreetness while getting in touch with prospective clients. As organizations navigate increasingly competitive markets, understanding the nuances of headhunting becomes vital for effective recruitment strategies. To keep up with the technological advancements, it is better to optimise your hiring process by employing online recruitment software like HackerEarth, which enables companies to conduct multiple interviews and evaluation tests online, thus improving candidate experience. By collaborating with skilled headhunters who possess industry expertise and insights into market trends, companies can enhance their chances of securing high-caliber professionals who drive success in their respective fields.

View all