Meta title: From training metrics to skills metrics: L&D transition guide Meta description: A step-by-step guide for moving from training metrics to skills metrics in L&D. Practical stages, pitfalls, what to measure instead of completions. Read time: 8 min read
Moving from training metrics to skills metrics: a step-by-step transition guide for L&D teams
Moving from training metrics to skills metrics means replacing activity measures — enrollments, completions, seat time — with evidence that people can actually do the work. It is the single biggest reporting shift facing L&D leaders right now, and most transitions stall in the same place: at the point where the CFO asks what a "validated skill" is and no one has a defensible answer.
This guide is a step-by-step transition path for L&D teams making that move. It assumes you already believe the shift is necessary. It focuses instead on the operational sequence — what to measure first, what to retire last, and where most rollouts quietly fail.
Why training metrics stopped working
Completion rates were never designed to prove capability. They were designed to prove attendance. That was fine when compliance training was the dominant L&D use case and the question was "did they sit through it." It is no longer fine when the question is "can they use the AI tools we bought them, and did that change how they work."
Two shifts made the old metrics untenable. First, learning content moved from instructor-led classroom to self-paced digital, which made completion cheap and near-meaningless — you can complete a Coursera course by clicking through. Second, the CFO started asking about outcomes. Josh Bersin and others have argued for several years that learning has become a performance discipline rather than a training one (see Bersin's "The Definitive Guide to Building a High-Impact Learning Culture" for the fuller argument), and the practical consequence is that L&D leaders are being asked to prove skill acquisition, not participation.
Related industry analysis has documented a recurring pattern: companies investing heavily in learning platforms often cannot demonstrate workforce capability change, because their measurement systems track the platform, not the person. MIT Sloan Management Review's coverage of reskilling and workforce measurement reflects this same tension.
What skills metrics actually measure
Skills metrics measure demonstrated capability against a defined standard. That standard is the hard part. A skills metric is only as good as the rubric behind it, and most L&D functions do not yet have the rubrics.
A usable skills metric has four properties:
- A named skill, defined precisely enough that two evaluators would agree on what it means (e.g., "writes a Python function that handles the specified edge cases" — not "Python proficiency")
- A proficiency level, expressed as a scale the business recognises (novice / working / advanced / expert, or a numeric equivalent)
- A validation method, which is how you know the person is at that level (assessment, work product review, peer validation, project sign-off)
- A time stamp, because skills decay and validations expire
If any of the four is missing, the metric is a training metric wearing a skills-metric costume.
The step-by-step transition guide for L&D teams
The move from training metrics to skills metrics is not a rebrand of existing dashboards. It is a rework of what you collect, how you validate it, and how you report it upward. Below is the sequence we have seen work when L&D teams make this transition in enterprises of 5,000 employees or more.
Step 1: Audit what you are already measuring
Before adding skills metrics, list every learning metric currently reported to any stakeholder above you — CHRO, CFO, business unit heads. For each one, answer: what decision does this metric drive? Most L&D teams find that half their reported metrics drive no decision at all. Those get retired first, not last. Retiring dead metrics frees reporting bandwidth for the metrics that will replace them.
Step 2: Define a skills taxonomy — narrower than you think
Every L&D transition tries to build a comprehensive skills taxonomy in year one. Almost every one fails. The taxonomy is too broad, the definitions too abstract, and by month nine the managers refuse to tag their teams against it.
Start narrower. Pick two to four job families that matter most to the business — often engineering, data, sales, and one at-risk category — and build the taxonomy for those first. Deloitte Insights' The skills-based organization: A new operating model for work and the workforce (2022) notes that most durable rollouts sequence taxonomy development by business impact, not by org-chart coverage.
For each skill in scope, write the definition, the proficiency levels, and one example of what "working" proficiency looks like in a real deliverable. If you cannot describe the deliverable, the skill is not defined tightly enough.
Step 3: Pick your validation methods per skill
Not every skill validates the same way. Coding skills validate through structured assessment. Consultative selling validates through call review and deal outcomes. Regulatory knowledge validates through scenario-based testing. Presentation skills validate through peer or manager observation against a rubric.
The mistake is choosing one validation method for the whole taxonomy — usually an assessment platform because it is easiest to measure — and then getting pushback from the business that "you're not measuring what actually matters." Match the method to the skill, and be explicit that some skills will have softer signal than others. Based on what we have seen at HackerEarth, serving 500+ enterprises globally, teams that acknowledge this trade-off up front tend to make more progress than teams that pretend one platform solves every skill.
Step 4: Pilot on one skill cluster before scaling
Run the new measurement on one skill cluster — say, five to eight related skills within one job family — for one quarter before touching the enterprise dashboard. This is where most transitions save themselves. You will discover that your proficiency definitions are ambiguous, that managers refuse to validate at the cadence you planned, or that the assessment cost per person is higher than budgeted. Better to find that at pilot scale.
During the pilot, track two things: the skill data itself, and the friction cost of collecting it. If validating one skill for one person takes 40 minutes of manager time, the program will not survive contact with the calendar.
Step 5: Retire training metrics in pairs, not all at once
For every new skills metric you promote to the executive dashboard, retire one training metric. Not two. Not the whole set. One.
This paired retirement matters for two reasons. It forces the L&D team to defend each new metric against the one it is replacing, which sharpens the argument. And it gives the CFO and CHRO a clean before/after comparison — "we used to measure X, now we measure Y, here is why Y drives a better decision."
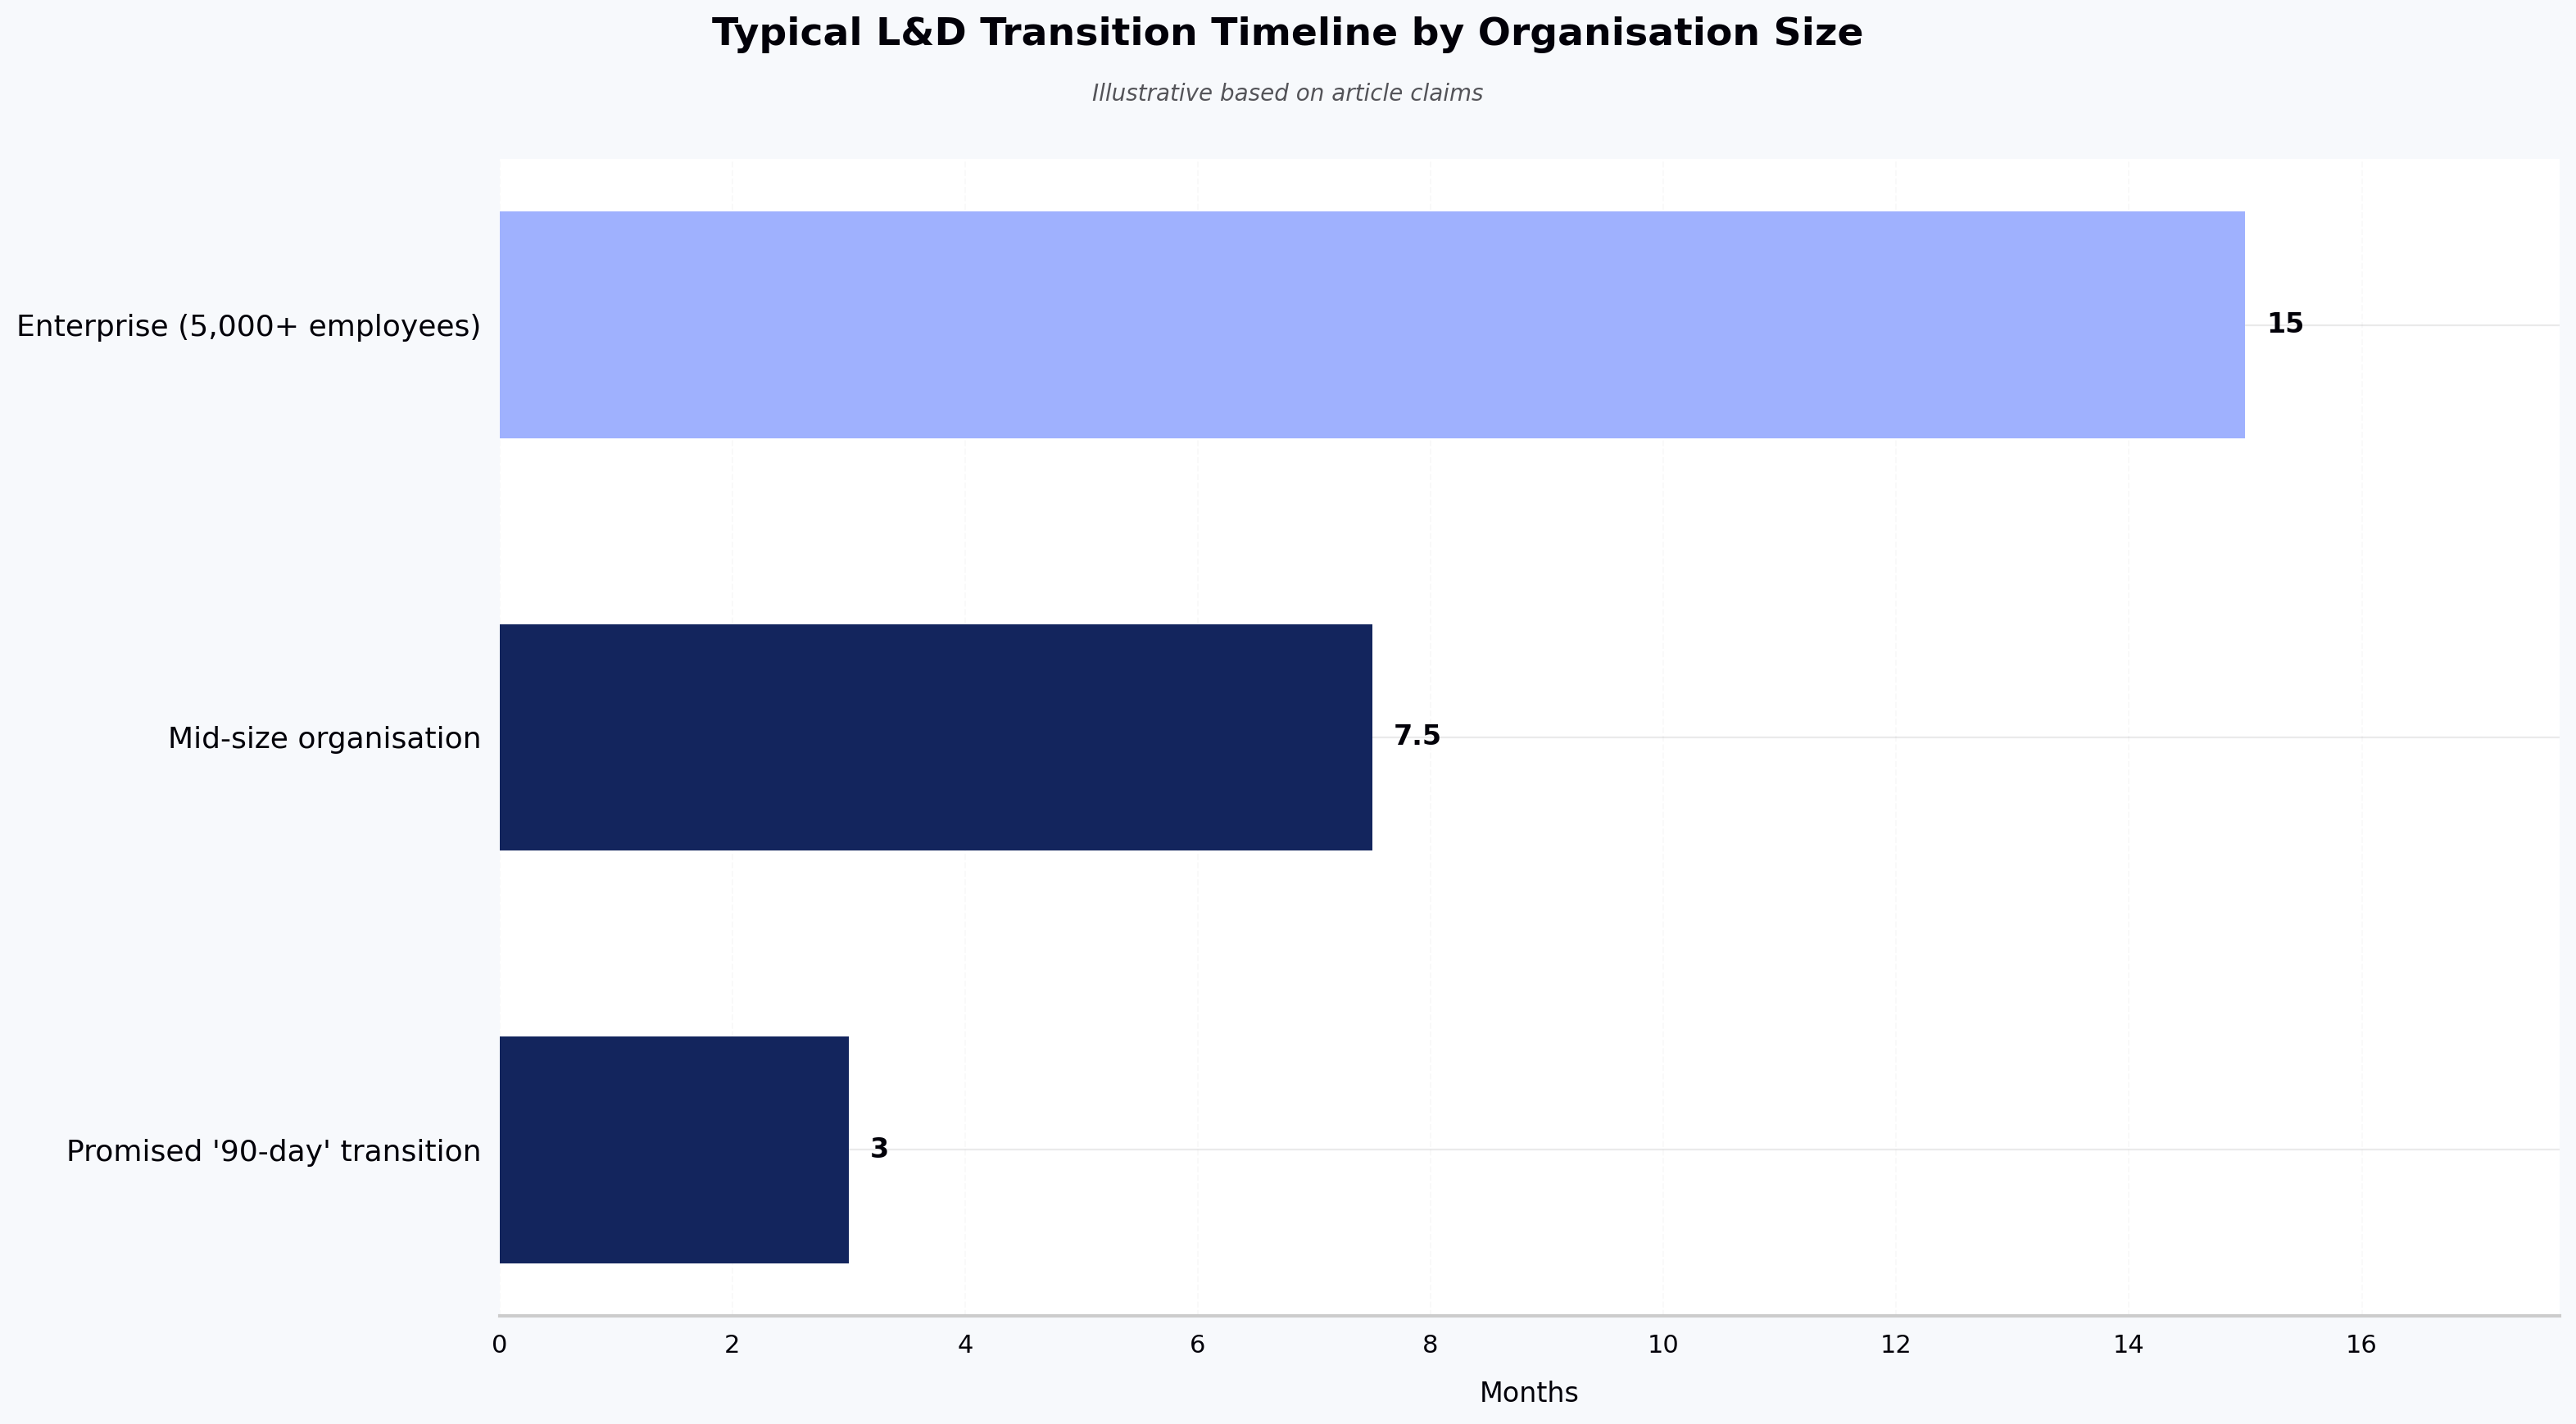
Full replacement of the training-metric dashboard typically takes 12 to 18 months at enterprise scale, based on rollouts we have observed. Announcing "we no longer track completions" in month three, before the skills data is stable, is how L&D teams lose credibility they spent years building.
Step 6: Wire skills data into decisions the business already makes
A skills metric that lives in an L&D dashboard is a report. A skills metric that gates a project staffing decision, a promotion, or an internal move is infrastructure. The transition is complete when someone outside L&D — a staffing manager, a hiring manager, a business unit head — looks at skills data to make a decision they used to make on gut.
This usually means integration with the systems those people already use: the HRIS (Workday, SAP SuccessFactors) for mobility, the ATS or interview platform (Greenhouse, Lever, HackerEarth Assessments) for hiring, the project-staffing tool (Kantata, Float) for utilisation. Skills data that requires people to log into a new tool to consume it gets ignored.
What to measure instead of completions: the replacement skills metrics
The replacement metrics fall into three tiers. Report them at different cadences to different audiences.
Capability metrics — the skills themselves. How many people at working proficiency in named skill X, trend over quarters, gap versus target. This is the CHRO / board-level view.
Movement metrics — how skill acquisition translates to workforce outcomes. Internal mobility rate, time to fill from internal candidates, project-staffing coverage for critical skills. This is the CHRO and business-unit view.
Application metrics — evidence that acquired skills are being used. Committed AI-assisted code per developer per week, deals closed using a new methodology, tickets resolved after a skill validation. This is the toughest to measure and the most valuable when you can.
Notice that completions do not appear on any tier. Completion data is fine to keep as an internal L&D operational metric — it tells you whether people are engaging with the content you built — but it should not appear on any dashboard you send upward.
Where most transitions fail
Three failure modes account for the majority of stalled rollouts.
The taxonomy that never stabilises. Skills definitions keep getting revised, so year-over-year comparisons become impossible. Fix: freeze the taxonomy at each annual review, and version it. Changes go into the next version, not retroactively.
The manager-validation bottleneck. The program depends on managers validating skill levels, and managers do not have time. Fix: automate what you can (assessments, work-product analysis), reserve manager time for the skills where their judgment is genuinely required, and be honest about which category each skill falls into.
The parallel-dashboard problem. L&D reports skills metrics; the business still asks for completion rates because that's what they've always seen. Fix: sequenced retirement (Step 5) and a single quarterly executive review that presents only the new metrics. If two dashboards exist, the old one wins.
Frequently asked questions
How long does the transition from training metrics to skills metrics take?
At enterprise scale (5,000+ employees), 12 to 18 months to fully retire training-metric reporting and stabilise skills-metric reporting. Smaller organisations move faster, sometimes in 6 to 9 months, because the taxonomy scope is smaller and manager coordination is easier. In our observation, anyone promising a 90-day transition is measuring something narrower than a full L&D reporting shift.
Do we abandon completion rates entirely?
No. Completion rates remain useful as an internal operational metric — they tell you if content is being consumed and where drop-off happens. The change is that completion rates stop appearing on any executive dashboard. They become a diagnostic tool for the L&D team, not a proof point for the CFO.
What is the biggest hidden cost in this transition?
Manager validation time. Every skills program that depends on manager sign-off underestimates how much of that sign-off will actually happen. Budget for it explicitly, or automate the validation for skills where automation is defensible. If you don't, the program stalls at Step 4.
How does AI fluency fit into a skills taxonomy?
AI fluency is not one skill — it is a cluster (prompt design, tool selection, output evaluation, agentic workflow design, model-comparison judgment). Treating it as a single "AI-ready / not AI-ready" flag produces a metric no one trusts. Validation methods for this cluster typically require a hands-on environment where people demonstrate the skill against real tasks rather than answer questions about it.
Can we run skills metrics and training metrics in parallel indefinitely?
You can, but you shouldn't. Parallel reporting confuses stakeholders about which number matters and lets the business default to the metric they recognise. Sequenced retirement (Step 5) is the discipline that forces the transition to complete.
Next steps
If you are starting this transition, the highest-leverage first move is Step 1 — audit which of your current metrics actually drive a decision. Most L&D teams discover they can cut half their reporting before adding a single skills metric, which frees the bandwidth to do the taxonomy work well.
To see how workforce skill mapping, assessment data, and global benchmarking come together, schedule a walkthrough of HackerEarth's SkillsGraph with our team.