Guest Author

Author
Guest Author

Blogs
With years spent in HR trenches, Guest is passionate about what makes organizations tick—people. Their writing dives deep into behavioral interviews, talent strategy, and employee experience.
author’s Articles

Insights & Stories by Guest Author

Whether you're building your first team or scaling culture across regions, Guest Author's articles offer human-first insights rooted in real practice.
Clear all
Thank you! Your submission has been received!
Oops! Something went wrong while submitting the form.
Filter
Filter

Logging millions of requests every day and what it takes

HackerEarth's web servers handle millions of requests every day. These request logs can be analyzed to mine some really useful insights as well as metrics critical to the business, for example, the number of views per day, the number of views per sub product, most popular user navigation flow, etc.

Initial Thoughts

HackerEarth uses Django as its primary web development framework and a host of other components which have been customized for performance and scalability. During normal operations, our servers handle 80–90 requests/sec on an average and this surges to 200–250 requests/sec when multiple contests overlap in a time delta. We needed a system which could easily scale to a peak traffic of 500 requests/sec. Also, this system should add minimum processing overhead to the webservers, and the data collected needs to be stored for crunching and offline processing.

Architecture
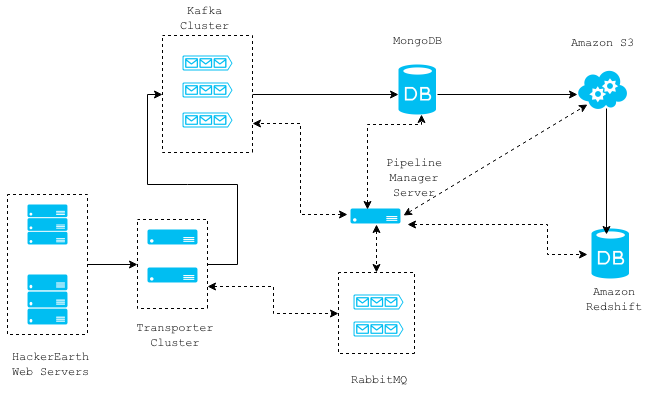
Logging Architecture

The diagram above shows a high level architecture of our request log collection system. The solid connection lines represent the data flow between different components and the dotted lines represent the communications. The whole architecture is message based and stateless, so individual components can easily be removed/replaced without any downtime.

You can read a more detailed explanation about each component in the order of data flow.

Web Servers

On the web servers, we employ a Django Middleware that asynchronously retrieves required data for a given request and then forwards it to the Transporter Cluster servers. This is done using a thread and the middleware adds an overhead of 2 milli seconds to the Django request/response cycle.

class RequestLoggerMiddleware(object):
    """
    Logs data from requests
    """
    def process_request(self, request):
        if settings.LOCAL or settings.DEBUG:
            return None

        is_ajax = request.is_ajax()
        request.META['IS_AJAX'] = is_ajax

        before = datetime.datetime.now()

        DISALLOWED_USER_AGENTS = ["ELB-HealthChecker/1.0"]
        http_user_agent = request.environ.get('HTTP_USER_AGENT', '')

        if http_user_agent in DISALLOWED_USER_AGENTS:
            return None

        # this creates a thread which collects required data and forwards it to the transporter cluster
        run_async(log_request_async, request)
        after = datetime.datetime.now()

        log("TotalTimeTakenByMiddleware %s" % ((after - before).total_seconds()))
        return None

Transporter Cluster

The transporter cluster is an array of non-blocking Thrift servers for the sole purpose of receiving data from the web servers and routing them to any other component like MongoDB, RabbitMQ, Kafka, etc. Where a given message should be routed to is specified in the message itself from the webservers. There is only one-way communication from the webservers to the transporter servers, and this saves time spent in the acknowledgement of message reception by thrift servers. We may lose some request logs due to this, but we can afford to do so. The request logs are currently routed to the Kafka cluster. The communication between the webservers and the transporter servers takes 1–2 milli seconds on an average and can be horizontally scaled to handle an increase in load.

service DataTransporter {
    oneway void transport(1:map<string, string> message)
}

Kafka Cluster

Kafka is a high throughput distributed messaging system that supports the publish/subscribe messaging pattern. This messaging infrastructure enables us to build other pipelines that depend on this stream of request logs. Our Kafka cluster stores last 15 days' worth of logs, so we can make any new consumer that we implement start processing data 15 days back in time.

Useful reference for setting up a kafka cluster.

Pipeline Manager Server

This server manages the consumption of request log messages from the Kafka topics, storing them in MongoDB and then later moving them to Amazon S3 and Amazon Redshift. MongoDB acts merely as a staging area for the data consumed from the Kafka topics and this data is transferred to S3 at hourly intervals. Every file that is saved in S3 is loaded into Amazon Redshift, which is a data warehouse solution that can scale to petabytes of data. We use Amazon Redshift for analyzing/metrics calculation from request log data. This server works in conjunction with a RabbitMQ cluster which it uses to communicate about task completion and initiation.

Here is the script that loads data from S3 into Redshift. This script handles insertion of duplicate data first by removing any duplicate rows and then by inserting the new data.

def load_s3_delta_into_redshift(s3_delta_file_path):
    bigdata_bucket = settings.BIGDATA_S3_BUCKET

    attrs = {
        'bigdata_bucket': bigdata_bucket,
        's3_delta_file_path': s3_delta_file_path,
    }

    complete_delta_file_path = "s3://{bigdata_bucket}/{s3_delta_file_path}".format(**attrs)
    schema_file_path = "s3://{bigdata_bucket}/request_log/s3_col_schema.json".format(**attrs)

    data = {
        'AWS_ACCESS_KEY_ID': settings.AWS_ACCESS_KEY_ID,
        'AWS_SECRET_ACCESS_KEY': settings.AWS_SECRET_ACCESS_KEY,
        'LOG_FILE':  complete_delta_file_path,
        'schema_file_path': schema_file_path
    }

    S3_REDSHIFT_COPY_COMMAND = " ".join([
        "copy requestlog_staging from '{LOG_FILE}' ",
        "CREDENTIALS 'aws_access_key_id={AWS_ACCESS_KEY_ID};aws_secret_access_key={AWS_SECRET_ACCESS_KEY}'",
        "json '{schema_file_path}';"
    ]).format(**data)

    LOADDATA_COMMAND = " ".join([
        "begin transaction;",
        "create temp table if not exists requestlog_staging(like requestlog);",
        S3_REDSHIFT_COPY_COMMAND,
        'delete from requestlog using requestlog_staging where requestlog.row_id=requestlog_staging.row_id;',
        'insert into requestlog select * from requestlog_staging;',
        "drop table requestlog_staging;",
        'end transaction;'
    ])

    redshift_conn_args = {
        'host': settings.REDSHIFT_HOST,
        'port': settings.REDSHIFT_PORT,
        'username': settings.REDSHIFT_DB_USERNAME
    }

    REDSHIFT_CONNECT_CMD = 'psql -U {username} -h {host} -p {port}'.format(**redshift_conn_args)
    PSQL_LOADDATA_CMD = '%s -c "%s"' % (REDSHIFT_CONNECT_CMD, LOADDATA_COMMAND)

    returncode = subprocess.call(PSQL_LOADDATA_CMD, shell=True)
    if returncode != 0:
        raise Exception("Unable to load s3 delta file into redshift ", s3_delta_file_path)

What's next

Data is like gold for any web application. If done the right way, the insights that it can provide and the growth it can drive is amazing. There are dozens of features and insights that can be built with the requests logs, including recommendation engine, better content delivery, and improving the overall product. All of this is a step toward making HackerEarth better every day for our users.

This post was originally written for the HackerEarth Engineering blog by Praveen Kumar.

Scaling database with Django and HAProxy

MySQL – Primary data store

At HackerEarth, we use MySQL database as the primary data store. We have experimented with a few NoSQL databases on the way, but the results have been largely unsatisfactory. The distributed databases like MongoDB or CouchDB aren't very scalable or stable. Right now, our status monitoring services use RethinkDB for storing the data in JSON format. That's all about using NoSQL database for now.

With the growing amount of data and number of requests every second, it turns out that the database becomes a major bottleneck to scale the application dynamically. At this point if you are thinking that there are mythical (cloud) providers who can handle the growing need of your application, you couldn't be more wrong. To make matters worse, you can't spin a new database whenever you want to just like you do with your frontend servers. Achieving horizontal scalability at all levels requires massive re-architecture of the system while being completely transparent to the end user. This is what a part of our team has focused on in the last few months, resulting in high uptime and availability.

It was becoming difficult for the master (and only) MySQL database to handle the heavy load. We thought we will delay any scalability at this level till the single database could handle the load. We would work on other high priority tasks instead. But that wasn't to be, and we experienced some down time. After that we did a rearchitecture of our application, sharded the database, wrote database routers and wrappers on top of django ORM, put HAProxy load balancer infront of the MySQL databases, and refactored our codebase to optimize it significantly.

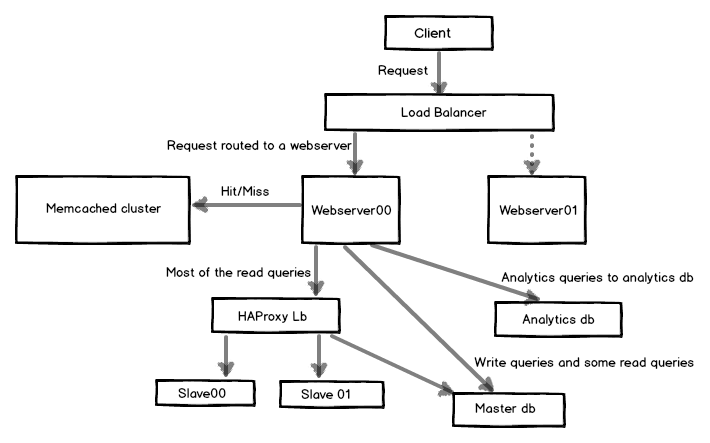
The image below shows a part of the architecture we have at HackerEarth. Many other components have been omitted for simplicity.

Database slaves and router

The idea was to create read replicas and route the write queries to the master database and read queries to slave (read replica) databases. But that was not simple either. We couldn't and wouldn't want to route all the read queries to slaves. There were some read queries which couldn't afford stale data, which comes as a part of database replication. Though stale data might be the order of just a few seconds, these small number of read queries couldn't even afford that. The first database router was simple:
class MasterSlaveRouter(object):

"""
Represents the router for database lookup.
"""
def __init__(self):
if settings.LOCAL:
self._SLAVES = []
else:
self._SLAVES = SLAVES

def db_for_read(self, model, **hints):
"""
Reads go to default for now.
"""
return 'default'

def db_for_write(self, model, **hints):
"""
Writes always go to default.
"""
return 'default'

def allow_relation(self, obj1, obj2, **hints):
"""
Relations between objects are allowed if both objects are
in the default/slave pool.
"""
db_list = ('default',)
for slave in zip(self._SLAVES):
db_list += slave

if obj1._state.db in db_list and obj2._state.db in db_list:
return True
return None

def allow_migrate(self, db, model):
return True

All the write and read queries go to the master database, which you might think is weird here. Instead, we wrote getfromslave(), filterfromslave(), getobjector404fromslave(), getlistor404fromslave(), etc. as part of django ORM in our custom managers to read from slave. So whenever we know we can read from slaves, we call one of these functions. This was a sacrifice made for those small number of read queries which couldn't afford the stale data. Custom database manager to fetch data from slave:
# proxy_slave_X is the HAProxy endpoint, which does load balancing

# over all the databases.
SLAVES = ['proxy_slave_1', 'proxy_slave_2']

def get_slave():
"""
Returns a slave randomly from the list.
"""
if settings.LOCAL:
db_list = []
else:
db_list = SLAVES

return random.choice(db_list)

class BaseManager(models.Manager):
# Wrappers to read from slave databases.
def get_from_slave(self, *args, **kwargs):
self._db = get_slave()
return super(BaseManager, self).get_query_set().get(*args, **kwargs)

def filter_from_slave(self, *args, **kwargs):
self._db = get_slave()
return super(BaseManager, self).get_query_set().filter(
*args, **kwargs).exclude(Q(hidden=True) | Q(trashed=True))

HAProxy for load balancing

Now there could me many slaves at a time. One option was to update the database configuration in settings whenever we added/removed a slave. But that was very cumbersome and inefficient. A better way was to put a HAProxy load balancer in front of all the databases and let it detect which one is up or down and route the read queries according to that. This would mean never editing the database configuration in our codebase — just what we wanted. A snippet of /etc/haproxy/haproxy.cfg:
listen mysql *:3305

mode tcp
balance roundrobin
option mysql-check user haproxyuser
option log-health-checks
server db00 db00.xxxxx.yyyyyyyyyy:3306 check port 3306 inter 1000
server db01 db00.xxxxx.yyyyyyyyyy:3306 check port 3306 inter 1000
server db02 db00.xxxxx.yyyyyyyyyy:3306 check port 3306 inter 1000

The configuration for the slave in settings now looked like this:
DATABASES = {

'default': {
'ENGINE': 'django.db.backends.mysql',
'NAME': 'db_name',
'USER': 'username',
'PASSWORD': 'password',
'HOST': 'db00.xxxxx.yyyyyyyyyy',
'PORT': '3306',
},
'proxy_slave_1': {
'ENGINE': 'django.db.backends.mysql',
'NAME': 'db_name',
'USER': 'username',
'PASSWORD': 'password',
'HOST': '127.0.0.1',
'PORT': '3305',
},
'analytics': {
'ENGINE': 'django.db.backends.mysql',
'NAME': 'db_name',
'USER': 'username',
'PASSWORD': 'password',
'HOST': 'db-analytics.xxxxx.yyyyyyyyyy',
'PORT': '3306',
},
}

But there is a caveat here too. If you spin off a new server with the HAproxy configuration containing some endpoints which don't exist, HAproxy will throw an error and it won't start, making the slave useless. It turns out there is no easy solution to this, and haproxy.cfg should contain existing server endpoints while initializing. The solution then was to let the webserver update its HAproxy configuration from a central location whenever it starts. We wrote a simple script in fabric to do this. Besides, the webserver already used to update its binary when the spin off is from an old image.

Database sharding

Next, we sharded the database. We created another database — analytics. It stores all the computed data, and it forms a major part of read queries. All the queries to the analytics database are routed using the following router:
class AnalyticsRouter(object):

"""
Represents the router for analytics database lookup.
"""
def __init__(self):
if settings.LOCAL:
self._SLAVES = []
self._db = 'default'
else:
self._SLAVES = []
self._db = 'analytics'

def db_for_read(self, model, **hints):
"""
All reads go to analytics for now.
"""
if model._meta.app_label == 'analytics':
return self._db
else:
return None

def db_for_write(self, model, **hints):
"""
Writes always go to analytics.
"""
if model._meta.app_label == 'analytics':
return self._db
else:
return None

def allow_relation(self, obj1, obj2, **hints):
"""
Relations between objects are allowed if both objects are
in the default/slave pool.
"""

if obj1._meta.app_label == 'analytics' or \
obj2._meta.app_label == 'analytics':
return True
else:
return None

def allow_migrate(self, db, model):
if db == self._db:
return model._meta.app_label == 'analytics'
elif model._meta.app_label == 'analytics':
return False
else:
return None

To enable the two routers, we need to add them in our global settings:
DATABASE_ROUTERS = ['core.routers.AnalyticsRouter', 'core.routers.MasterSlaveRouter']


Here the order of routers is important. All the queries for analytics are routed to the analytics database and all the other queries are routed to the master database or their slaves according the nature of queries. For now, we have not put slaves for analytics database but as the usage grows that will be fairly straightforward to do. At the end, we had an architecture where we could spin off new read replicas and route the queries fairly simply and had a high performance load-balancer in front of the databases. All this has resulted in a much higher uptime and stability in our application, and we could focus more on what we love to do — building products for programmers. We already had an automated deployment system in place, which made the experimentation easier and enabled us to test everything thoroughly. The refactoring and optimization that we did in codebase and architecture also reduced the server count by more than two times. This has been a huge win for us, and we are now focusing on rolling out exciting products in the next few weeks. Stay tuned!

I would love to know how others have solved similar problems. Do give suggestions and point out potential quirks.

P.S. You might be interested in The HackerEarth Data Challenge that we are running.

Follow me @vivekprakash. Write to me at vivek@hackerearth.com.

This post was originally written for the HackerEarth Engineering blog by Vivek Prakash.

Continuous Deployment System

This is one of the coolest and most important things we recently built at HackerEarth.

What's so cool about it? Just have a little patience, you will soon find out. But make sure you read till the end :)

I hope to provide valuable insights into the implementation of a Continuous Deployment System(CDS).

At HackerEarth, we iterate over our product quickly and roll out new features as soon as they are production ready. In the last two weeks, we deployed 100+ commits in production, and a major release comprising over 150+ commits is scheduled for launch within a few days. Those commits consist of changes to backend app, website, static files, database, and so on.

We have over a dozen different types of servers running, for example, webserver, code-checker server, log server, wiki server, realtime server, NoSQL server, etc. All of them are running on multiple EC2 instances at any point in time. Our codebase is still tightly integrated as one single project with many different components required for each server. When there are changes to the codebase, you need to update all the related dedicated servers and components when deploying in production. Doing that manually would have just driven us crazy and would have been a total waste of time!

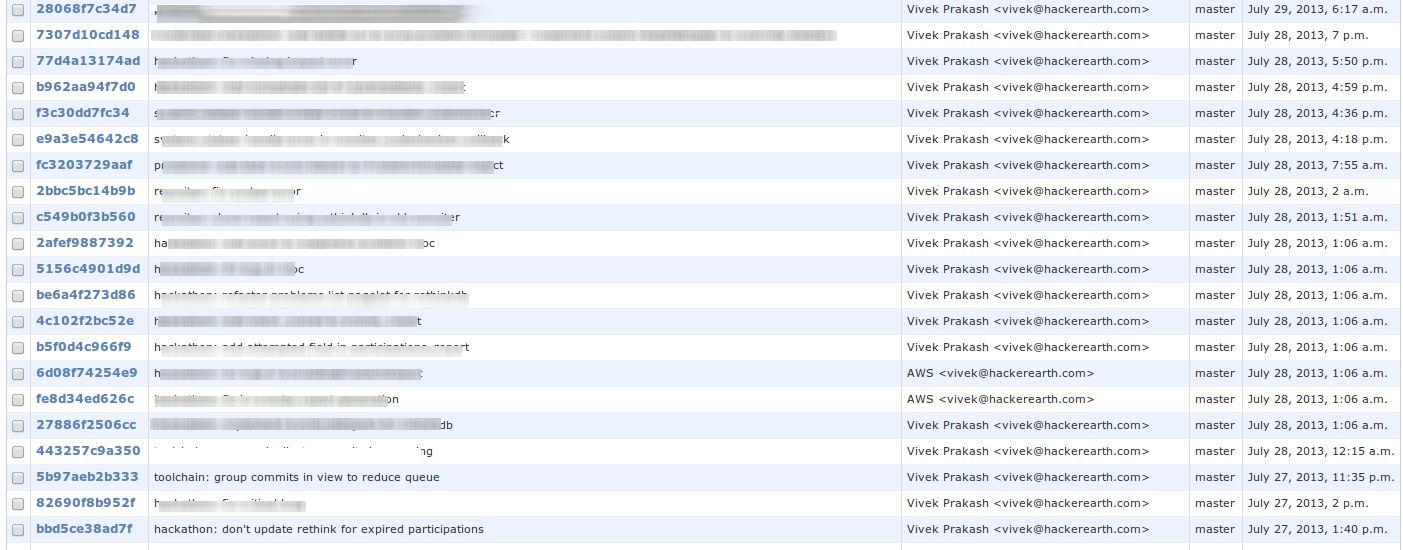
Look at the table of commits deployed on a single day.


And with such speed, we needed an automated deployment system along with automated testing. Our implementation of CDS helped the team roll out features in production with just a single command: git push origin master. Also, another reason to use CDS is that we are trying to automate everything, and I see us going in right direction.

CDS Model

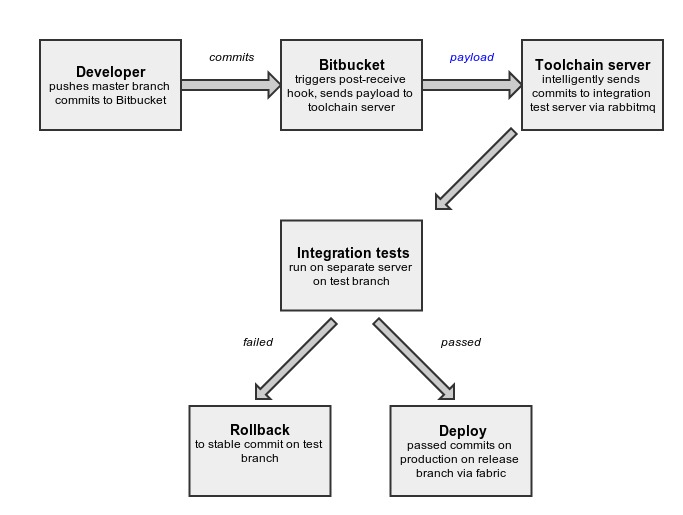
The process begins with the developer pushing a bunch of commits from his master branch to a remote repository, which in our case is set up on Bitbucket. We have set up a post hook on Bitbucket, so as soon as Bitbucket receives commits from the developer, it generates a payload(containing information about commits) and sends it to the toolchain server.

The toolchain server backend receives the payload and filters commits based on the branch and neglects any commit that is not from the master branch or of the type merge commit.


    def filter_commits(branch=settings.MASTER_BRANCH, all_commits=[]):

"""
Filter commits by branch
"""

commits = []

# Reverse commits list so that we have branch info in first commit.
all_commits.reverse()

for commit in all_commits:
if commit['branch'] is None:
parents = commit['parents']
# Ignore merge commits for now
if parents.__len__() > 1:
# It's a merge commit and
# We don't know what to do yet!
continue

# Check if we just stored the child commit.
for lcommit in commits:
if commit['node'] in lcommit['parents']:
commit['branch'] = branch
commits.append(commit)
break
elif commit['branch'] == branch:
commits.append(commit)

# Restore commits order
commits.reverse()
return commits


Filtered commits are then grouped intelligently using a file dependency algorithm.
    def group_commits(commits):

"""
Creates groups of commits based on file dependency algorithm
"""


# List of groups
# Each group is a list of commits
# In list, commits will be in the order they arrived
groups_of_commits = []

# Visited commits
visited = {}

# Store order of commits in which they arrived
# Will be used later to sort commits inside each group
for i, commit in enumerate(commits):
commit['index'] = i

# Loop over commits
for commit in commits:
queue = deque()

# This may be one of the group in groups_of commits,
# if not empty in the end
commits_group = []

commit_visited = visited.get(commit['raw_node'], None)
if not commit_visited:
queue.append(commit)

while len(queue):
c = queue.popleft()
visited[c['raw_node']] = True
commits_group.append(c)
dependent_commits = get_dependent_commits_of(c, commits)

for dep_commit in dependent_commits:
commit_visited = visited.get(dep_commit['raw_node'], None)
if not commit_visited:
queue.append(dep_commit)

if len(commits_group)>0:
# Remove duplicates
nodes = []
commits_group_new = []
for commit in commits_group:
if commit['node'] not in nodes:
nodes.append(commit['node'])
commits_group_new.append(commit)
commits_group = commits_group_new

# Sort list using index key set earlier
commits_group_sorted = sorted(commits_group, key= lambda
k: k['index'])
groups_of_commits.append(commits_group_sorted)

return groups_of_commits


The top commit of each group is sent for testing to the integration test server via rabbitmq. First, I wrote code which sent each commit for testing, but it was too slow. So Vivek suggested that I group commits from payload and run a test on the top commit of each group, which drastically reduced number of times tests are run. Integration tests are run on the integration test server. There is a separate branch called test on which tests are run. Commits are cherry-picked from master onto test branch. Integration test server is a simulated setup to replicate production behavior. If tests are passed, then commits are put in release queue from where they are released in production. Otherwise, the test branch is rolled back to a previous stable commit and clean-up actions are performed, including notifying the developer whose commits failed the tests.

Git Branch Model

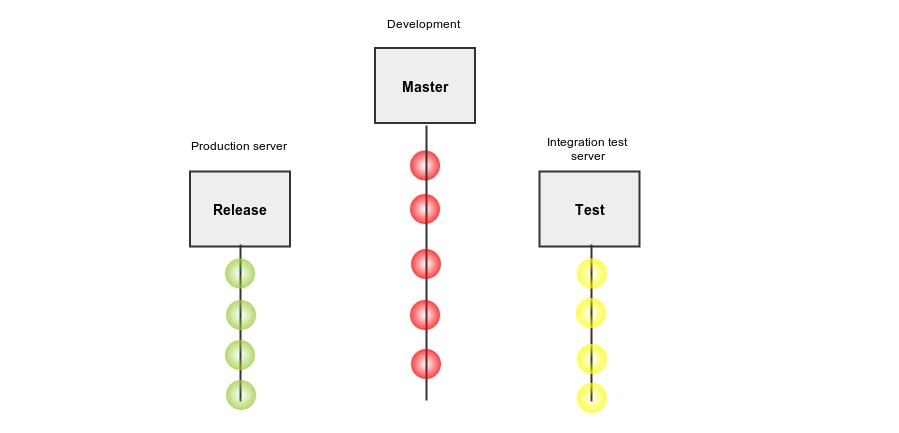
We have been using three branches — master, test, and release. In the Master, the developer pushes the code. This branch can be unstable. Test branch is for the integration test server and release branch is for the production server. Release and test branches move parallel, and they are always stable. As we write more tests, the uncertainty of a bad commit being deployed to production will reduce exponentially.

Django Models

Each commit(or revision) is stored in the database. This data is helpful in many circumstances like finding previously failed commits, relating commits to each other using file dependency algorithm, monitoring deployment, etc. Following are the Django models used:* Revision- commithash, commitauthor, etc. * Revision Status- revisionid, testpassed, deployedonproduction, etc. * Revision Files- revisionid, filepath * Revision Dependencies. When the top commit of each group is passed to the integration test server, we first find its dependencies, that is, previously failed commits using the file dependency algorithm, and save it in the Revision Dependencies model so that we can directly query from the database the next time.
def get_dependencies(revision_obj):

dependencies = set()
visited = {}

queue = deque()
filter_id = revision_obj.id
queue.append(revision_obj)

while len(queue):
rev = queue.popleft()
visited[rev.id] = True
dependencies.add(rev)
dependent_revs = get_all_dependent_revs(rev, filter_id)

for rev in dependent_revs:
r_visited = visited.get(rev.id, None)
if not r_visited:
queue.append(rev)
#remove revision from it's own dependecies set.
#makes sense, right?
dependencies.remove(revision_obj)
dependencies = list(dependencies)
dependencies = sorted(dependencies, key=attrgetter('id'))
return dependencies

def get_all_dependent_revs(rev, filter_id):
deps = rev.health_dependency.all()
if len(deps)>0:
return deps

files_in_rev = rev.files.all()
files_in_rev = [f.filepath for f in files_in_rev]

reqd_revisions = Revision.objects.filter(files__filepath__in=files_in_rev, id__lt=filter_id, status__health_status=False)
return reqd_revisions

As we saw earlier in the Overview section, these commits are then cherry-picked onto the test branch from the master branch, and the process continues.

Deploying to Production

Commits that passed integration tests are now ready to be deployed. There are a few things to consider when deploying code to production, such as restarting webserver, deploying static files, running database migrations, etc. The toolchain code intelligently decides which servers to restart, whether to collect static files or run database migrations, and which servers to deploy on based on what changes were done in the commits. You might have noticed we do all this on the basis of types and categories of files changed/modified/deleted in the commits to be released. You might also have noted that we control deployment to production and test servers from the toolchain server (that's the one which receives payload from bitbucket). We use fabric to achieve this. A great tool indeed for executing remote administrative tasks!
from fabric.api import run, env, task, execute, parallel, sudo

@task
def deploy_prod(config, **kwargs):
"""
Deploy code on production servers.
"""

revision = kwargs['revision']
commits_to_release = kwargs['commits_to_release']

revisions = []
for commit in commits_to_release:
revisions.append(Revision.objects.get(raw_node=commit))

result = init_deploy_static(revision, revisions=revisions, config=config,
commits_to_release=commits_to_release)
is_restart_required = toolchain.deploy_utils.is_restart_required(revisions)
if result is True:
init_deploy_default(config=config, restart=is_restart_required)

All these processes take about 2 minutes for deployment on all machines for a group of commits or single push. Our life is a lot easier; we don't worry anymore about pushing our code, and we can see our feature or bug fix or anything else live in production in just a few minutes. Undoubtedly, this will also help us release new features without wasting much time. Now deploying is as simple as writing code and testing on a local machine. We also deployed the hundredth commit to production a few days ago using automated deployment, which stands testimony to the robustness of this system. P.S. I am an undergraduate student at IIT-Roorkee. You can find me @LalitKhattar.

This post was originally written for the HackerEarth Engineering blog by Lalit Khattar, Summer Intern 2013 @HackerEarth